Original Article – DOI: 10.33594/000000890
CPB (60): 560 - 575
Accepted: 28.08.2026 - Published: 19.09.2026
Genetic Susceptibility to Allergic Rhinitis: Impact of IL-4 Rs2243250 Polymorphism on Inflammatory Markers and Leukocyte Profiles
bImam Ali Hospital, Laboratory Department, Baghdad, Iraq
cDepartment of Medical Laboratory Techniques, College of Health and Medical Technology, Al-Farabi University, Baghdad, Iraq,
dBiotechnology Research Center, Al-Nahrain University, Baghdad, Iraq
Keywords
Abstract
Background/Aims: Allergic rhinitis is a common chronic inflammatory disease affecting millions of people worldwide and substantially impairing quality of life. This study aimed to investigate the association of the IL-4 rs2243250 polymorphism with allergic rhinitis, inflammatory markers, and leukocyte profiles. Methods: A total of 182 participants were included, comprising 91 patients with allergic rhinitis and 91 healthy controls. Peripheral blood samples were collected for complete blood count, DNA extraction, and measurement of IL-4, IL-13, and IgE levels using enzyme-linked immunosorbent assays. Skin prick testing for weed, grass, tree, and mite allergens was performed to confirm IgE-mediated sensitization. The IL-4 rs2243250 polymorphism was detected by polymerase chain reaction followed by restriction fragment length polymorphism analysis using the AvaII restriction enzyme. Results: Significant differences (P < 0.001) between patients and controls were observed for all investigated immunological markers and differential white blood cell counts. For rs2243250, the CC genotype was associated with a reduced likelihood of allergic rhinitis (OR = 0.25; 95% CI: 0.11–0.55), whereas the TT genotype was associated with an increased likelihood (OR = 3.8; 95% CI: 1.82–8.17). Similarly, the C allele was associated with reduced disease likelihood (OR = 0.35; 95% CI: 0.23–0.53), while the T allele was associated with increased likelihood (OR = 2.88; 95% CI: 1.88–4.41; P < 0.001). Significant positive correlations among several white blood cell types were also observed. Conclusion: The findings demonstrate an association between the IL-4 rs2243250 polymorphism and allergic rhinitis. The C allele and CC genotype were associated with reduced disease likelihood, whereas the T allele and TT genotype were associated with increased likelihood. These genetic associations, together with alterations in inflammatory markers and leukocyte profiles, may contribute to understanding susceptibility to allergic rhinitis.
Introduction
Allergy rhinitis (AR) is among the most important medical problems in the globe. Nearly half a billion people around the world suffer from this allergic inflammation (Nur Husna et al.,2022) [1]. Due to a rise in prevalence over time, AR is generally a prevalent condition and a global concern (Pawankar,2014) [2]. There are many risk factors that have contributed over the years to the spread of allergic rhinitis, including human regionalism, as rural areas are less exposed to pollutants linked to increased AR. It can be concluded that urbanized cities are more exposed to the disease (Elholm et al.,2016) [3]. In addition to increasing the frequency of seasonal allergies, climate change is also extending the pollen season, as seen in Europe over the last three decades (Bergmann et al., 2020) [4]. The nasal blockage, rhinorrhea, pruritus and sneezing are the most common symptoms of this illness (Bousquet et al., 2020) [5]. It is commonly known that AR is mediated by the Th2 type immune response. Although AR is influenced by both genetic and environmental variables, further research is still needed to determine its precise etiology (Greiner et al., 2011) [6]. One of the advanced molecular techniques in the field of genetics is the identification of genetic polymorphisms closely linked to large population groups around the world and their association with allergic diseases (Choi et al., 2021) [7]. Regarding the higher incidence and frequency of allergic rhinitis in twins and atopic families, there is clear evidence of a genetic link to the condition (Choi et al., 2021) [8]. The immunoregulatory cytokines interlukin-4 (IL-4) and interlukin-13 (IL-13) are primarily released by activated Th2 cells. In recent years, IL4 and IL-13 have gained widespread recognition as important mediators in the pathophysiology of AR, and they have a direct impact on Th2 cell development and drift. Because they have the same receptor subunit, IL-4 and IL-13 are essential for IgE-dependent inflammatory responses and for inducing IgE synthesis in B cells. Numerous allergic reactions, such as asthma, AR, mucus [9] and [10]. The current study aims to determine whether there is an association between genetic polymorphism rs2243250 in the IL-4 gene and the development of allergic rhinitis.
Materials and Methods
Ethical permit
All study participants agreed to provide blood samples and other information for an examination in accordance with the Helsinki Declaration. Written informed consent was obtained from all adult participants prior to enrollment; for participants under the legal age of consent, written informed consent was obtained from a parent or legal guardian, with the child's assent also obtained where age-appropriate. The study protocol was reviewed and approved by the Research Ethics Committee of Al- Kadhimiya Educational Hospital and Allergic and Asthma Center in Baghdad-Iraq, ethics committee No. 29/492 in 15 /8/2024.
Study design
In this work, a study was designed between two groups of patients and controls to determine the relationship between the genetic polymorphism rs2243250 in the IL-4 gene and allergy rhinitis development. A total of 182 individuals participated in the present study. The control group comprised 91 participants, while the patient’s group comprised the other 91. Participants were recruited between January 2023 and December 2024; the age of participants ranged from 6 to 65 years across both groups.
Selection the study groups
Patients’ group selection. A total of ninety-one patients suffering from allergy rhinitis were visited the Kadhimiya Educational Hospital and Allergic and Asthma Center in Baghdad-Iraq. All cases were diagnosed by specialist’s physician. Controls’ group selection. In order to exclude bias and confounding, the control group in this study was carefully selected. A control group of ninety-one healthy people was chosen for this investigation. The control group sample was chosen based on a group of criteria in selecting the study sample, including family history of the disease, geographical area, and similar circumstances to avoid variation in results. Criteria of population samples selection. The study sample was chosen based on a number of factors, such as a history of allergic rhinitis, a positive physical examination, and a positive skin-prick test. Diagnosis of allergic rhinitis was established according to the Allergic Rhinitis and its Impact on Asthma (ARIA) clinical criteria, requiring the presence of at least two typical nasal symptoms (rhinorrhea, nasal obstruction, itching, or sneezing) confirmed by a positive skin-prick test to at least one of the tested aeroallergens. However, patients with lung disease, psoriasis, autoimmune diseases, malignant diseases, diffuse dermatitis, or respiratory infections were excluded. Healthy people without a family history of asthma, allergies, airway illnesses, atopy, or a potential chronic systemic disorder were not included in the control group.
Blood collection
6 ml of venous blood were collected from every participant. 3 ml of this were quickly put into EDTA tubes; the complete blood count (CBC) was performed on this fresh, unfrozen EDTA blood on the same day of collection, after which the remaining sample was stored at -20°C until DNA extraction. To estimate IL-4, IL-13 and IgE levels, the remaining 3 ml was put in a gel tube for serum isolation.
IL-4, IL-13 and IgE measurement
Serum was separated from whole blood collected in a gel tube using a centrifuge for all blood samples in order to estimate the amount of 1L-4, IL-13 and IgE in the populations in the current investigation. The serum was divided into 3 Eppendorf tubes and stored at a temperature of -20 degrees Celsius until the evaluation of interleukin 13, interleukin 4, and IgE. A human ELISA kit of IL-4 (Sunlong, catalog no. SL0997Hu) and IL-13 (Sunlong, catalog no. SL0974Hu) was used in accordance with manufacturing recommendations. For IgE estimation, an IgE Chemiluminescence assay on the Roche Cobas e411 immunoassay platform (Roche Diagnostics, Germany) was used for this purpose.
Skin prick test (SPT)
One technique for identifying the existence of particular immunoglobulin E (IgE)-mediated reactions is the skin prick test (SPT). A qualified healthcare professional who has received training in both identifying and treating anaphylaxis should undertake SPT. The test was conducted according to the following steps: A skin marker was placed straight directly on the inner part of the forearm. Subsequently, each allergen solution was administered to the skin in a sequential manner, with one drop being placed at a time. After that, the skin was punctured by piercing the droplet while maintaining a vertical orientation of the scalpel. A consistent pressure was sustained for a duration of one second, following which the scalpel was then withdrawn. The drying method was used instead of wiping to avoid the risk of cross-contamination with allergens on the arm. After the 10-15 min test period, the circumference of each red mark was carefully measured to determine its diameter. A test was considered positive when the mean wheal diameter was ≥ 3 mm greater than that produced by the negative control. Histamine dihydrochloride (10 mg/mL) and the allergen diluent solution were used as the positive and negative controls, respectively, run alongside each panel. Allergen extracts were sourced from Stallergenes Greer. Participants were instructed to discontinue antihistamines and other medications known to suppress the wheal-and-flare response prior to testing, in line with standard SPT washout guidance.
Complete blood count (CBC)
The phrase "complete blood count" encompasses a battery of tests conducted in a medical laboratory to provide information on the cellular composition of an individual's blood. The comprehensive blood count offers data about the quantity of blood cells, encompassing both leukocytes and erythrocytes, as well as platelets, along with the levels of hemoglobin and hematocrit. To quantify the different types of white blood cells, one can add the differential of the white blood cells to the red blood cell indices, which indicate the average size and hemoglobin content inside the red blood cells. CBC parameters were measured using an automated hematology analyzer (Sysmex XN-350, Sysmex Corporation, Japan), based on the electrical impedance (Coulter) principle.
Detection of IL-4 genetic polymorphism rs2243250
Extraction of DNA. According to the Tonk-Bio Genomic DNA extraction kit (USA) recommendation, the DNA was extracted. The Nanodrop apparatus was utilized to assess the concentration and purity of DNA. A volume of 1µl from each DNA sample was used for measurement. The concentration and purity of the extracted DNA ranged from 60 to 150 nanograms per microliter (ng/µl) and was within the range of 1.8 to 2 optical density at a wavelength of 260 nm/280 nm.
Preparing and selection of primers. In the present work, all primers which used for the detection IL-4 genes were listed in Table1. The specific primers were diluted with nuclease-free water to reach a final concentration of 100μM. The primer stock solution was then stored at -20°C until it was needed.
PCR condition for IL-4 gene. 10μl of PCR premix (Bioneer/Korean), 5μl of DNA template, 2μl of both forward and reverse primers (10μM), and nuclease-free water were used to create the final 20μl volume of PCR amplification. The final undigested PCR amplicon size was 195 bp; this product was subsequently subjected to AvaII restriction digestion (see below) to resolve the rs2243250 genotype, yielding fragments of 175 bp + 20 bp for the C allele (which contains the AvaII recognition site) and an uncut 195 bp fragment for the T allele (which lacks the site).
The Restriction fragment length polymorphism (RFLP). The characteristics of IL-4 (rs2243250) variants primers sequencing, restriction fragment sizes, and restriction enzymes are illustrated in Table 1. The undigested PCR amplicon for rs2243250 was 195 bp; the fragment sizes listed in Table 1 are those obtained after AvaII digestion of this amplicon, not the size of the amplicon itself.
rs2243250 polymorphism detection. The PCR cycling parameters for the rs2243250 polymorphism were conducted as follows: One cycle of the principal denaturation phase at 95°C for five minutes, followed by 35 cycles of the denaturation step at 95°C for 30 seconds, the annealing step at 57°C for 30 seconds, and the extension step at 72°C for 30 seconds. The PCR reaction was terminated by running one cycle for the infinite step at 4°C after a 10-minute cycle for the final extension step at 72°C. The amplified PCR products were digested using AvaII for rs2243250 as described: 5 µl of the PCR product was combined with 0.5 µl of the enzyme. Then, 2.5 µl of buffer was mixed with 17 µl of sterile distilled water. The mixture was then incubated at 37 °C for 1 hour before being subjected to gel electrophoresis.
Agarose gel preparation and electrophoresis. One gram of agarose powder was dissolved in 100 ml of TEB buffer to prepare a 1% concentration of gel that was used for DNA fragment separation. The mixture of powder and buffer was heated in the microwave for 30 seconds until the agarose was completely dissolved. After cooling to 50–60°C, the agarose gel was mixed with 2 μl of red safe dye and carefully poured into the tray, being careful not to create air bubbles between the comb's teeth. The gel was then left to set for 30–40 minutes at room temperature. The tray was placed in the tank, and the comb was gently removed once the final gel solidification was complete. 8 μl of loaded DNA were carefully placed into an agarose electrophoresis gel well after DNA samples were first mixed with a loading dye so that 5 μl of each DNA sample were combined with 3 μl of loading dye. After the electrophoresis tank was sealed with its unique cover, an electric current was run for 75 minutes at 70 volts. Using a UV transilluminator, the DNA sample was observed and captured on camera using UV light at 336 nm.

Table 1: The primers set of IL-4 (rs2243250). Primer sequences and restriction enzymes were used in Table 2 according to [11]
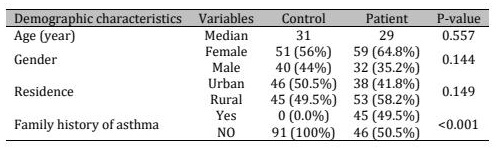
Table 2: The significant differences between cases and controls according to demographic characteristics
Statistical analysis
The statistical analysis of this case control study was performed with the statistical package for social sciences (SPSS) 20.0 and Microsoft Excel 2013. Numerical data were tested for normality using the Shapiro-Wilk test, which indicated an approximately normal distribution for the continuous immunological and hematological variables; these are accordingly presented as mean ± standard error (SE) and were compared using the independent-samples t-test for two groups and one-way ANOVA for comparisons among more than two groups. Categorical data were described as count and percentage. Chi-square test or fisher exact test used to estimate the association between variables. The lower level of accepted statistically significant difference is bellow or equal to 0.05. Odds ratio was calculated in order to measure the potential risk of mutant allele in Asthmatic patients to predispose a disease risk, in addition to heterozygous genotype and homozygous mutant in comparison with homozygous wild genotype. Hardy-Weinberg equilibrium in the control group was assessed using a chi-square goodness-of-fit test comparing observed genotype counts with those expected under equilibrium, calculated from the observed allele frequencies. Pearson's correlation coefficient was used to assess the relationship between continuous immunological and hematological variables, consistent with the approximately normal distribution established above. Pairwise comparisons between the three rs2243250 genotype groups (CC, CT, and TT) were performed directly using the independent-samples t-test for each pairwise contrast (CC vs. CT, CC vs. TT, and CT vs. TT), rather than a global ANOVA with post-hoc correction, since each pairwise genotype contrast was of a priori interest.
Results
The significant variations between controls and cases according to demographic characteristics is illustrated in Table 1. Concerning the age group, the results record insignificant differences between group study (P=0.557). Likewise, the results showed that insignificant differences (P=0.149) between the study groups according to residence. For the family history of the disease, the results report significant variations (P=0.001) between cases and controls. For allergy types, Table 3 explain the percentage of allergy types among patients’ group according to type of allergen. The results recorded the allergy reaction rates of the patients as follows: 74.72%, 61.53%, 48.35%, and 32.96% for weed, grass, trees, and mites respectively. As for the results of patients who were not allergic, the percentages were as follows: 67.04%, 51.65%, 38.46%, and 25.28% for mites, trees, grass and weed respectively. Separately, 58.24% of patients (n = 53) reported concurrent use of allergy-related medication (chiefly antihistamines) at the time of enrollment; this is a clinical characteristic of the cohort and not an additional SPT allergen category. For immunological markers, the significant differences between controls and patients noted in Table4. The results showed clear highly significant differences P < 0.001 between patients and healthy individuals for all types of WBCs as well as IL-4 and IL-13. Table 5 illustrates the significant differences between patients and control groups in immunological markers. The results of IgE levels in sera as well as WBC counts of the study group were significantly (P < 0.001) higher in cases than in controls. The significant differences in lymphocyte (P=0.03), monocyte (P=0.01), and neutrophil (P=0.02) recorded between patients and control groups in males. Likewise, eosinophil, basophil, IL-4, and IL-13 showed highly significant differences (P< 0.001) between patients and controls in the male group. For the female group, the significant differences between patients and control groups in immunological markers are clarified in Table 6. All immunological markers in the female group demonstrated high significance (P < 0.001) in cases compared to controls
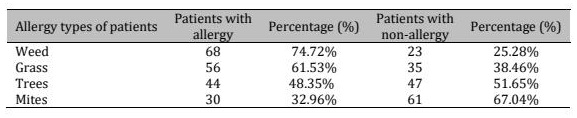
Table 3: The percentage of allergy types of patients according to allergen
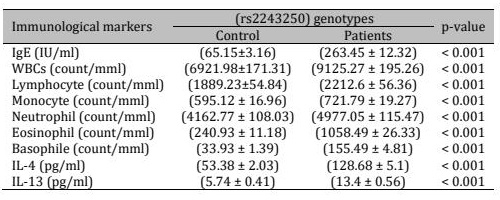
Table 4: WBCs differential count between patients and controls
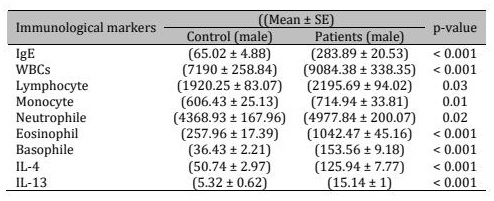
Table 5: Significant differences between controls and patients in male according to the immunological markers
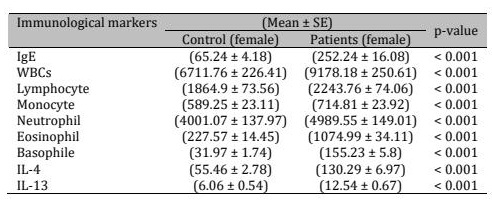
Table 6: Significant differences between controls and patients in female according to the immunological markers
Detection of rs2243250 SNP in IL-4
Fig. 1 displays the specific band of rs2243250 SNP in IL-4 gene at 195bp for TC and TT, and 175bp for CC genotypes. These results clarify the two alleles T and C in rs2243250 SNP in both cases and controls group. The genotypes and allele frequency proportion of the rs2243250 genetic polymorphism in the IL-4 gene are clarified in Table 7. The present results noted that the CT genotype in the control group was more prevalent than the other genotypes, where the CT, CC, and TT genotypes were 44%, 39.6%, and 16.4%, respectively. Nevertheless, the proportion of genotypes in the case group showed that the CT and TT genotypes were equal in proportion and were higher compared to the CC genotype, where the proportion of CT and TT was 42.9%, while the CC genotype proportion was 14.2%. For the CC genotype, OR was 0.25 (95% CI = 0.11 - 0.55), indicating a significant protective effect (P < 0.001). Whereas the OR of the CT genotype was 0.96 (95% CI = 0.53 - 1.71), indicating no significant association (P=1). The OR of the TT genotype was 3.8 (95% CI = 1.82 - 8.17), indicating a significant (P < 0.001) etiological factor. Moreover, the OR of C and T allele frequencies were 0.35 (95% CI: 0.23 - 0.53) and 2.88 (95% CI: 1.88 - 4.41), respectively, indicating that the C allele is significantly protective and the T allele is a significant etiological factor (< 0.001), respectively. Genotype distribution in the control group did not deviate from Hardy-Weinberg equilibrium (observed vs. expected genotype counts in Table 7; χ² = 0.47, df = 1, P = 0.495), supporting the reliability of the genotyping procedure. The results in Table 8 explain the significant differences between male and female patients according to CC genotype. The results recorded highly significant differences (P < 0.001) in monocyte. On the other hand, insignificant differences (P > 0.05) are listed in Table 8 for other types of WBCs between male and female patients. For TC genotypes, insignificant differences (P > 0.05) between male and female patients were observed in differential WBCs that are listed in Table 9. In Table 10, insignificant differences (P > 0.05) between male and female patients are seen in differential WBCs according to TT genotype.The results summarized in Table 11 describe the significant variation between male and female patients in IgE antibody levels according to rs2243250 genotypes. The results reported insignificant differences between patients’ groups (P > 0.05). Table 12 clarified the significant differences between male and female patients in IL-4 and IL-13 levels in sera according to rs2243250 genotypes. Concerning IL-4, the results indicated insignificant differences (P > 0.05) between male and female in all forms of genotypes CC, TC, and TT, while IL-13 noted the significant differences (P = 0.01) between male and female in patients with CC and TT genotypes. Insignificant differences (P > 0.05) were seen in patients with TC genotypes according to IL-13 levels. The significant differences between patients in IL-4 and IL-13 levels according to their genotyping patterns are shown in Table 13. The results in Table 13 clarify insignificant differences (P > 0.05) between all patients in the study groups according to genetic polymorphism of rs2243250 in IL-4 and IL-13 levels. For IgE and differential WBCs, the significant differences between patients according to their genotyping patterns are displayed in Table 14. Statistically significant differences were observed only between patients with CC genotypes against TT in IgE (P = 0.03), WBCs (P = 0.04), and lymphocytes (P = 0.05). Likewise, a significant difference was noted between patients with CC against TC genotypes in lymphocytes (P = 0.02); the corresponding WBC comparison between CC and TC genotypes did not reach statistical significance (P = 0.06). Regarding other immune markers, no statistical significance was found among patients. Further studies are needed to explain the above results.
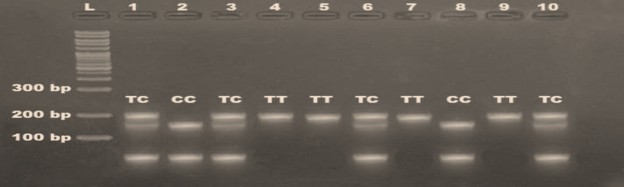
Fig. 1: The results of the RFLP amplification of the polymorphic genotypes in rs2243250 SNP in IL-4 gene. The PCR products were electrophoresed (70 V for 75 minutes) in 1% agarose gels containing red safe stain. The bands were illustrated by UV light. L lane represents a 100-bp molecular weight marker.
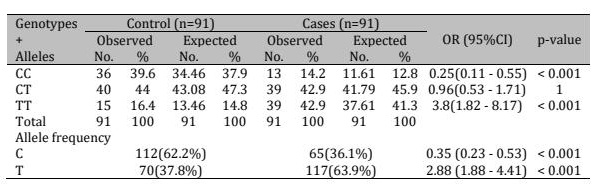
Table 7: IL-4 (rs2243250) genotyping and alleles frequencies in cases compared to controls
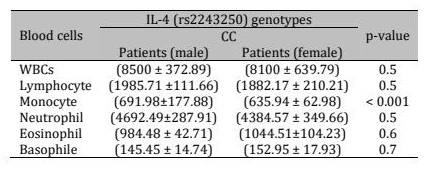
Table 8: Significant differences between male and female patients in the differential white blood cells count according to the CC genotype
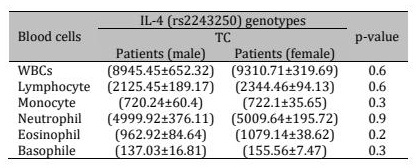
Table 9: Significant differences between male and female patients in the differential white blood cells count according to the TC genotype
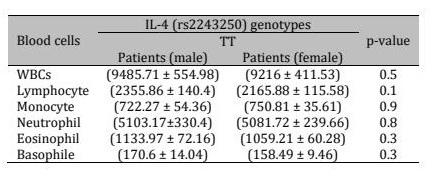
Table 10: Significant differences between male and female patients in the differential white blood cells count according to the TT genotype
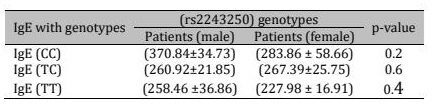
Table 11: Significant differences between male and female patients in IgE antibody according to rs2243250 genotypes
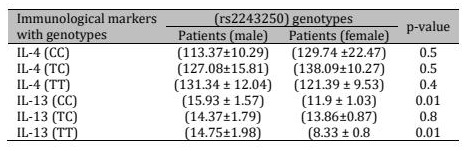
Table 12: Significant differences between male and female patients in IL-4 and IL-13 according to rs2243250 genotypes
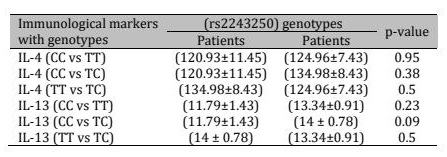
Table 13: Significant differences between all patients in IL-4 and IL-13 according to rs2243250 genotypes
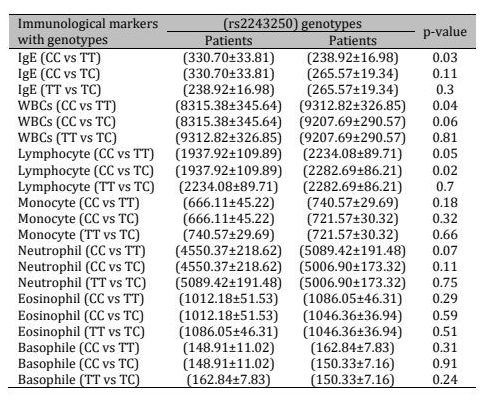
Table 14: Significant differences between all patients in IgE and differential WBCs according to rs2243250 genotypes
Correlation between immunological markers in the study groups
The results summarized in Table 15 explained the correlation between levels of immunological factors in the study groups. For the case group (n = 91, df = 89), correlation coefficients with |r| ≥ 0.207 are statistically significant at P < 0.05; coefficients below this threshold, referred to as "insignificant" throughout the text, did not reach statistical significance. Concerning the IgE antibody, the correlation relationship in Table 15 was insignificantly weakly positive with monocyte (r = 0.11), neutrophil (r = 0.1), basophil (r = 0.07), and IL-4 (r = 0.17). No correlation was seen between IgE and lymphocyte and eosinophil (r = 0). Analogously, there was a non-significant negative correlation between IgE and IL-13 level (r=-0.15). For WBC count, the results recorded a significant positive correlation with lymphocytes, monocytes, neutrophils, eosinophils, and basophils (r = 0.78, 0.84, 0.96, 0.79, and 0.8, respectively). On the other hand, the results noted insignificant weak negative and positive correlations between WBCs and IL-4 (r=-0.08) and IL-13 (r=0.06), respectively. The results in Table 15 also explain the correlation between the differential WBCs and IgE, IL-4, and IL-13. For monocyte, the results reported a positive correlation with neutrophil (r=0.92) and basophil (r=0.75); in contrast, the results pointed to an insignificant weak positive correlation between monocyte and lymphocyte (r=0.41), eosinophil (r=0.47), IL-4 (r=0.01), and IL-13 (r=0.12). Regarding neutrophils, the result indicated a significant positive correlation with eosinophils (r=0.66) and basophils (r=0.76). While the results of the current study recorded a weak, statistically insignificant negative correlation between neutrophils and IL-4 (r=-0.03) and a positive correlation between neutrophils and IL-13 (r=0.1). The positive significant correlation between eosinophils and basophils (r=0.77) was seen in the present results, on the one hand, and on the other hand, there was a weak positive insignificant correlation with IL-13 (r=0.01) and a weak negative insignificant correlation with IL-4 (r=-0.15). For basophils, the results were found to have a weak negative insignificant correlation with IL-4 (r=-0.07) and a weak positive insignificant correlation with IL-13 (r=0.06). The correlation between IL-4 and IL-13 in the current work was observed to be a weak, positive, insignificant one (r=0.12). Table 15 can be summarized regarding the correlation between white blood cells and the levels of interleukins. There is a weak negative correlation with IL-4, in contrast to IL-13, where the results showed a weak positive correlation. With the exception of the lymphocyte cells, the results revealed a weak negative correlation with IL-4 and IL-13 together.
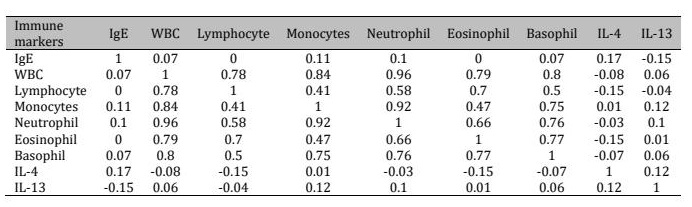
Table 15: Immunological markers levels Pearson’s correlation in case group
Discussion
IL-4 and IL-13 are considered pivotal players in the pathogenesis of allergic rhinitis [12]. The present result in Table 4 reported high significance between patients and controls (P < 0.001) in IL-4 and IL-13 levels. This result is supported by the results of a study conducted by [13], where it was observed that allergic rhinitis was characterized by the presence of high levels of IL-4 and IL-13. In addition, the results of the current study recorded statistically significant (P < 0.001) differences in IgE levels between study groups (Table 4). This result is related to the fact that IL-4 and IL-13 work to cause major diseases by causing the activation of B-cells, which can activate the production of IgE antibodies, thus stimulating the goblet cells and inducing mucus overproduction through the airway stimulation response [14]. Moreover, some previous evidence has shown a link between the development of asthma and allergic rhinitis and the overproduction of IgE antibodies, which may indicate that it is a good immune indicator in diagnosing respiratory diseases [15]. The results of the current study agreed with [16] that clarify the presence of IgE antibody levels in patients as a result of the presence of some stimuli such as grass and trees. The results of the current study are also consistent with [17] and [18], which indicated that IgE-associated hypersensitivity is a frequent problem caused by allergen sources such as house dust mite, grass pollen and other foods that responsible for activation the hypersensitivity and then IgE mediated. Studies have shown that adults with allergies do not develop sensitization to new allergens, but rather exhibit a stable pattern of IgE reactivity to a specific group of allergens [19]. Allergen-associated IgE levels are decreased in patients who are already sensitized in the absence of allergen exposure, while they are elevated upon exposure [20]. Interestingly, contact with isolated allergens across the nasal mucosa can lead to increased IgE levels [21]. Furthermore, increased secondary IgE production can only be induced by allergen molecules containing intact IgE antigens, not by allergen derivatives containing only T-cell antigens [22]. This evidence is consistent with the results of the current study in Table 3, which is that allergens differ from one person to another, and on this basis, IgE antibody levels may be produced according to the type of stimulus. The result in Table 4 presented highly significant differences (P < 0.001) between patients and controls in WBC differential cells. The results of the current study were consistent with the results of study [23], which showed that the patients with moderate-severe allergic rhinitis have elevated levels of activated and pathogenic eosinophils, which are also associated with increased production of IL-4 in their serum. Eosinophils are known to play an active role in chronic allergic diseases [24]. A close association has been demonstrated by the presence of a number of eosinophils in nasal smears, a biomarker for patients with allergic rhinitis [25]. There is further evidence that eosinophil levels are associated with increased levels in patients with allergic rhinitis after exposure to allergens [26]. Regarding basophils, the binding of allergens to IgE leads to the degradation of basophils, which in turn releases several pro-inflammatory mediators, such as histamine, causing allergic symptoms [27]. This fact may be explained by the presence of elevated basophil levels. Concerning neutrophile levels in the sera of groups in the current work, the results clarify highly significant differences (P < 0.001) between patients and controls. Neutrophils are produced in large quantities in the bone marrow through the process of granulopoiesis [28]. They play an important role in innate immunity, representing 50-70% of their presence in the blood [29]. In addition, this type of cell is recruited in response to inflammatory cytokines [30] and subsequently migrates from the bloodstream to tissues in response [31]. Neutrophils are activated during hypersensitivity reactions by decreased levels of selectin, a protein important in neutrophil migration [32]. The presence of high levels of neutrophils in the sera of patients with allergic rhinitis may be explained by the fact that neutrophils express both FcεRI [33] and FcγRs [34] receptors and can therefore be stimulated directly by allergens and via mast cells. Additional research has verified that neutrophils function as antigen-presenting cells (APCs) and have the ability to stimulate the growth of T cells specific to allergens that are engaged in the late-phase response [35]. This may explain the elevated levels of lymphocytes in the patients' sera due to their stimulation by neutrophils. Tables 5 and 6 in the present work explain the significant differences in immunological factors between patients and controls in males and females, respectively. Clearly, the results require further scientific investigation. The demographic region and sample size may be the most important determinants in interpreting these results. It is not possible to rely on a specific geographic region or sample size to determine the association. In general, many studies show that immune disorders are more commonly associated with females than males [36]. In the current study, however, statistically significant differences between patients and controls were observed in both sexes across all measured immunological parameters, including eosinophils, basophils, IL-4, and IL-13 (Table 5, Table 6), suggesting that the genotype-associated immune response in this cohort was not restricted to females. The results of the current study in Table 7 are consistent with those of study [37] regarding rs2243250, as the study showed that the TT genotype and T allele were associated with an increased risk of allergic rhinitis. In addition, a study by [38] demonstrated an association between rs2243250 and airborne allergens. Many studies have focused on the role of genetic polymorphisms in the development of diseases, including a study [39] that reported that the genotype TG in the genetic polymorphism rs2981572 in the IL-20 gene was associated with an increased risk of asthma. In fact, many interleukins and genetic polymorphisms in their genes have been linked in one way or another to the disease, whether as a protective or causative factor. For example, the [40] study clarifies a link between the genetic polymorphism rs2981572 in the IL-20 gene and kidney disease and a link between the genetic polymorphism rs20541 in the IL-13 gene and renal cell carcinoma [41]. Genetics, lifestyle, social, economic, and environmental factors, as well as the accessibility of health and treatment facilities offered by the national health system, all have an impact on human health. These components are combined to support prevention and help people lead sustainable, healthy lives [42]. The results of the current study in Tables 8, 9, 10, and 11 explain the comparison between male and female patients in immunological markers according to the genotypes of their genes. In fact, the results did not show any statistically significant differences except for the difference between patients’ groups in monocyte levels in Table 8 according to the CC genotype. A study [43] found that the immune and inflammatory response pathways of monocytes are more regulated in females than in males. This is due to the association of expression of some cells that show a sex bias. However, more studies are required to investigate these variations and associations in immune parameters and relationships depending on the human sex. The results in Table 12 show significant differences between the participating patients in the levels of IL-4 and IL-13 according to the rs2243250 genotypes they carry. The results recorded no significant difference between the patients in IL-4. On the contrary, statistically significant differences appeared between the participating patients with TT and CC genotypes in the levels of IL-13. These cytokines are key players in regulating allergy-associated inflammation, possessing significant immunomodulatory effects. They affect a wide range of immune cells, including B cells, eosinophils, basophils, monocytes, fibroblasts, endothelial cells, respiratory epithelial cells, smooth muscle cells, and keratinocytes. Recent studies have demonstrated the role of IL-4 and IL-13 in the development of several autoimmune diseases. Furthermore, these cytokines are suspected to play a major role in the pathogenesis of inflammatory arthritis. Recent research suggests that IL-4 and IL-13 may play an important role in inhibiting the inflammatory processes associated with rheumatoid arthritis and may also contribute to a positive modulation of the disease process [44]. However, there are other studies that need to be conducted to explain these differences. According to the results of Table 13, the increased production of IL-4 and IL-13 was not related to patients’ groups according to their genotyping of the rs2243250 polymorphism. This may be because patients generally expressed similar or somewhat similar levels of interleukin, and it is possible that this is due to the same geographical community, which may be defined by similar living conditions. This is likely due to the fact that the patients generally expressed similar interleukin levels, or the severity of the disease was similar. This may also be due to the fact that they live in a single geographic community, perhaps defined by similar living conditions. Regarding the results in Table 15, which indicate correlations between immune parameters, most of the study results recorded statistically insignificant correlations, whether positive or negative. At the same time, it became clear that correlations between blood cell types were positive and significant. This may explain the synergistic action of defensive blood cells in cases of immune diseases or various injuries to which the body is exposed. A study on metabolic syndrome found significant associations between white blood cells [45]. This study may be consistent with the general explanation of the association between blood cells and their synergistic function.
Conclusion
Based on these results, there is likely to be a link between the development of the disease and rs2243250 genetic polymorphisms in the IL-4 gene, consistent with prior meta-analytic evidence supporting this association. Beyond confirming the genetic association, the present study adds value by combining, within the same Iraqi cohort, rs2243250 genotyping with serum IL-4, IL-13, and IgE quantification and a full differential leukocyte profile, allowing the genetic, cytokine, and cellular dimensions of allergic rhinitis to be examined together rather than in isolation. Weak positive and negative correlations between immunological markers were seen on the one hand, and significant positive correlations between WBC types were seen on the other.
Acknowledgements
Author contributions
Alaq Kareem jawad:Study design, methodology, practical work, and sample collection.Fatma makni ayadi:Project supervision and post-writing manuscript review,methodology.Ahmed Flayyih Hasan:Corresponding author, methodology
Disclosure Statement
The authors have no conflicts of interest to declare
References
- Nur Husna, S. M., Tan, H. T., Md Shukri, N., Mohd Ashari, N. S., & Wong, K. K. (2022). Allergic Rhinitis: A Clinical and Pathophysiological Overview. Frontiers in medicine, 9, 874114. https://doi.org/10.3389/fmed.2022.874114
- Pawankar R. (2014). Allergic diseases and asthma: a global public health concern and a call to action. The World Allergy Organization journal, 7(1), 12. https://doi.org/10.1186/1939-4551-7-12.
- Elholm, G., Linneberg, A., Husemoen, L. L., Omland, Ø., Grønager, P. M., Sigsgaard, T., & Schlünssen, V. (2016). The Danish urban-rural gradient of allergic sensitization and disease in adults. Clinical and experimental allergy : journal of the British Society for Allergy and Clinical Immunology, 46(1), 103–111. https://doi.org/10.1111/cea.12583.
- Bergmann, K. C., Buters, J., Karatzas, K., Tasioulis, T., Werchan, B., Werchan, M., & Pfaar, O. (2020). The development of birch pollen seasons over 30 years in Munich, Germany-An EAACI Task Force report. Allergy, 75(12), 3024–3026. https://doi.org/10.1111/all.14470.
- Bousquet, J., Anto, J. M., Bachert, C., Baiardini, I., Bosnic-Anticevich, S., Walter Canonica, G., Melén, E., Palomares, O., Scadding, G. K., Togias, A., & Toppila-Salmi, S. (2020). Allergic rhinitis. Nature reviews. Disease primers, 6(1), 95. https://doi.org/10.1038/s41572-020-00227-0.
- Greiner, A. N., Hellings, P. W., Rotiroti, G., & Scadding, G. K. (2011). Allergic rhinitis. Lancet (London, England), 378(9809), 2112–2122. https://doi.org/10.1016/S0140-6736(11)60130-X.
- Choi, B. Y., Han, M., Kwak, J. W., & Kim, T. H. (2021). Genetics and Epigenetics in Allergic Rhinitis. Genes, 12(12), 2004. https://doi.org/10.3390/genes12122004.
- Dávila, I., Mullol, J., Ferrer, M., Bartra, J., del Cuvillo, A., Montoro, J., Jáuregui, I., Sastre, J., & Valero, A. (2009). Genetic aspects of allergic rhinitis. Journal of investigational allergology & clinical immunology, 19 Suppl 1, 25–31.
- Munitz, A., Brandt, E. B., Mingler, M., Finkelman, F. D., & Rothenberg, M. E. (2008). Distinct roles for IL-13 and IL-4 via IL-13 receptor alpha1 and the type II IL-4 receptor in asthma pathogenesis. Proceedings of the National Academy of Sciences of the United States of America, 105(20), 7240–7245. https://doi.org/10.1073/pnas.0802465105
- Guo, J., Apiou, F., Mellerin, M. P., Lebeau, B., Jacques, Y., & Minvielle, S. (1997). Chromosome mapping and expression of the human interleukin-13 receptor. Genomics, 42(1), 141–145. https://doi.org/10.1006/geno.1997.4628.
- Shirkani, A., Mansouri, A., Hosseini, R. F., Azad, F. J., Mahmoudian, R. A., Montazer, M., ... & Gholamin, M. (2019). The role of interleukin-4 and 13 gene polymorphisms in allergic rhinitis: a case control study. Reports of biochemistry & molecular biology, 8(2), 111.
- Nur Husna, S. M., Md Shukri, N., Tuan Sharif, S. E., Tan, H. T. T., Mohd Ashari, N. S., & Wong, K. K. (2022). IL-4/IL-13 Axis in Allergic Rhinitis: Elevated Serum Cytokines Levels and Inverse Association With Tight Junction Molecules Expression. Frontiers in molecular biosciences, 9, 819772. https://doi.org/10.3389/fmolb.2022.819772.
- Nur Husna, S. M., Tan, H. T., Md Shukri, N., Mohd Ashari, N. S., & Wong, K. K. (2021). Nasal Epithelial Barrier Integrity and Tight Junctions Disruption in Allergic Rhinitis: Overview and Pathogenic Insights. Frontiers in immunology, 12, 663626. https://doi.org/10.3389/fimmu.2021.663626
- Bezerra Barros, G. C., Paiva Ferreira, L. K. D., Ferreira, L. A. M. P., Mozzini Monteiro, T., Alves, A. F., Pereira, R. A., & Piuvezam, M. R. (2020). 4-Carvomenthenol ameliorates the murine combined allergic rhinitis and asthma syndrome by inhibiting IL-13 and mucus production via p38MAPK/NF-κB signaling pathway axis. International immunopharmacology, 88, 106938. https://doi.org/10.1016/j.intimp.2020.106938
- Rolinck-Werninghaus, C., Keil, T., Kopp, M., Zielen, S., Schauer, U., von Berg, A., Wahn, U., Hamelmann, E., & Omalizumab Rhinitis Study Group (2008). Specific IgE serum concentration is associated with symptom severity in children with seasonal allergic rhinitis. Allergy, 63(10), 1339–1344. https://doi.org/10.1111/j.1398-9995.2008.01692.x
- Wąsik, J., Likońska, A., & Kurowski, M. (2024). IgE-Mediated Allergy and Asymptomatic Sensitization to Cannabis Allergens-Review of Current Knowledge and Presentation of Six Cases. Medicina (Kaunas, Lithuania), 60(6), 954. https://doi.org/10.3390/medicina60060954
- Mpairwe H, Muhangi L, Ndibazza J, Tumusiime J, Muwanga M, et al. (2008) Skin prick test reactivity to common allergens among women in Entebbe, Uganda. Trans R Soc Trop Med Hyg 102: 367–373.
- Westritschnig K, Sibanda E, Thomas W, Auer H, Aspock H, et al. (2003) Analysis of the sensitization profile towards allergens in central Africa. Clin Exp Allergy 33: 22–27.
- Lupinek C, Marth K, Niederberger V, Valenta R (2012) Analysis of serum IgE reactivity profiles with microarrayed allergens indicates absence of de novo IgE sensitizations in adults. J Allergy Clin Immunol 130: 1418–1420 e1414.
- Niederberger V, Ring J, Rakoski J, Jager S, Spitzauer S, et al. (2007) Antigens drive memory IgE responses in human allergy via the nasal mucosa. Int Arch Allergy Immunol 142: 133–144.
- Durham SR, Smurthwaite L, Gould HJ (2000) Local IgE production. Am J Rhinol 14: 305–307.
- Egger C, Horak F, Vrtala S, Valenta R, Niederberger V (2010) Nasal application of rBet v 1 or non-IgE-reactive T-cell epitope-containing rBet v 1 fragments has different effects on systemic allergen-specific antibody responses. J Allergy Clin Immunol 126: 1312–1315 e1314.
- Chen, Y., Yang, M., Deng, J., Wang, K., Shi, J., & Sun, Y. (2020). Elevated Levels of Activated and Pathogenic Eosinophils Characterize Moderate-Severe House Dust Mite Allergic Rhinitis. Journal of immunology research, 2020, 8085615. https://doi.org/10.1155/2020/8085615
- McBrien, C. N., & Menzies-Gow, A. (2017). The Biology of Eosinophils and Their Role in Asthma. Frontiers in medicine, 4, 93. https://doi.org/10.3389/fmed.2017.00093
- Ciprandi, G., Vizzaccaro, A., Cirillo, I., Tosca, M., Massolo, A., & Passalacqua, G. (2005). Nasal eosinophils display the best correlation with symptoms, pulmonary function and inflammation in allergic rhinitis. International archives of allergy and immunology, 136(3), 266–272. https://doi.org/10.1159/000083953
- Kämpe, M., Stolt, I., Lampinen, M., Janson, C., Stålenheim, G., & Carlson, M. (2011). Patients with allergic rhinitis and allergic asthma share the same pattern of eosinophil and neutrophil degranulation after allergen challenge. Clinical and molecular allergy : CMA, 9(1), 3. https://doi.org/10.1186/1476-7961-9-3
- Eifan, A. O., & Durham, S. R. (2016). Pathogenesis of rhinitis. Clinical and experimental allergy : journal of the British Society for Allergy and Clinical Immunology, 46(9), 1139–1151. https://doi.org/10.1111/cea.12780
- Rosales C. (2018). Neutrophil: A Cell with Many Roles in Inflammation or Several Cell Types?. Frontiers in physiology, 9, 113. https://doi.org/10.3389/fphys.2018.00113
- Injarabian, L., Devin, A., Ransac, S., & Marteyn, B. S. (2019). Neutrophil Metabolic Shift during their Lifecycle: Impact on their Survival and Activation. International journal of molecular sciences, 21(1), 287. https://doi.org/10.3390/ijms21010287
- Chan, L., Karimi, N., Morovati, S., Alizadeh, K., Kakish, J. E., Vanderkamp, S., Fazel, F., Napoleoni, C., Alizadeh, K., Mehrani, Y., Minott, J. A., Bridle, B. W., & Karimi, K. (2021). The Roles of Neutrophils in Cytokine Storms. Viruses, 13(11), 2318. https://doi.org/10.3390/v13112318
- Chavakis, E., Choi, E. Y., & Chavakis, T. (2009). Novel aspects in the regulation of the leukocyte adhesion cascade. Thrombosis and haemostasis, 102(2), 191–197. https://doi.org/10.1160/TH08-12-0844
- Francis, A., Bosio, E., Stone, S. F., Fatovich, D. M., Arendts, G., Nagree, Y., Macdonald, S. P., Mitenko, H., Rajee, M., Burrows, S., & Brown, S. G. (2017). Neutrophil activation during acute human anaphylaxis: analysis of MPO and sCD62L. Clinical and experimental allergy : journal of the British Society for Allergy and Clinical Immunology, 47(3), 361–370. https://doi.org/10.1111/cea.12868
- Gounni, A. S., Lamkhioued, B., Koussih, L., Ra, C., Renzi, P. M., & Hamid, Q. (2001). Human neutrophils express the high-affinity receptor for immunoglobulin E (Fc epsilon RI): role in asthma. FASEB journal : official publication of the Federation of American Societies for Experimental Biology, 15(6), 940–949. https://doi.org/10.1096/fj.00-0378com
- Nimmerjahn, F., & Ravetch, J. V. (2008). Fcgamma receptors as regulators of immune responses. Nature reviews. Immunology, 8(1), 34–47. https://doi.org/10.1038/nri2206
- Polak, D., Hafner, C., Briza, P., Kitzmüller, C., Elbe-Bürger, A., Samadi, N., Gschwandtner, M., Pfützner, W., Zlabinger, G. J., Jahn-Schmid, B., & Bohle, B. (2019). A novel role for neutrophils in IgE-mediated allergy: Evidence for antigen presentation in late-phase reactions. The Journal of allergy and clinical immunology, 143(3), 1143–1152.e4. https://doi.org/10.1016/j.jaci.2018.06.005.
- Yung, J. A., Fuseini, H., & Newcomb, D. C. (2018). Hormones, sex, and asthma. Annals of allergy, asthma & immunology : official publication of the American College of Allergy, Asthma, & Immunology, 120(5), 488–494. https://doi.org/10.1016/j.anai.2018.01.016
- Jiang, F., & Yan, A. (2021). IL-4 rs2243250 polymorphism associated with susceptibility to allergic rhinitis: a meta-analysis. Bioscience reports, 41(4), BSR20210522. https://doi.org/10.1042/BSR20210522
- Shirkani A, Mansouri A, Farid Hosseini R, Jabbari Azad F, Mahmoudian R A, Montazer M, et al. . The Role of Interleukin-4 and 13 Gene Polymorphisms in Allergic Rhinitis: A Case Control Study. rbmb.net 2019; 8 (2) :111-118.
- Abbas, H.M., Hassan, R.A., Abbas, A.H., Dhabaan, A.A.N. The Relation of rs2981572 Polymorphism and IL-20 Levels in Asthma Patients Infected With Streptococcus. (2025). Al-Nahrain Journal of Science, 28(2), 113-121.
- Abbas, H., H. Abbas, A., Fadhil, Y., Dhabaan, A., & Saleh, T. (2025). Investigating the association between IL-20 gene rs2981572 polymorphism and Helicobacter pylori induced kidney disorders. Microbial Biosystems, 10(1), 263-272. doi: 10.21608/mb.2025.358807.1250
- Dhabaan, A. A. N., Abbas, H. M., Muhammed, H. J., & Saleh, T. H. (2024). Identification of the IL-13 gene rs20541 single nucleotide polymorphism and its association with renal cell carcinoma in Iraqi patients. Ukrainian Journal of Nephrology and Dialysis, (3(83), 41-50. https://doi.org/10.31450/ukrjnd.3(83).2024.06
- Chiarella, P., Capone, P., & Sisto, R. (2023). Contribution of Genetic Polymorphisms in Human Health. International journal of environmental research and public health, 20(2), 912. https://doi.org/10.3390/ijerph20020912
- So, J., Tai, A. K., Lichtenstein, A. H., Wu, D., & Lamon-Fava, S. (2021). Sexual dimorphism of monocyte transcriptome in individuals with chronic low-grade inflammation. Biology of sex differences, 12(1), 43. https://doi.org/10.1186/s13293-021-00387-y
- Iwaszko, M., Biały, S., & Bogunia-Kubik, K. (2021). Significance of Interleukin (IL)-4 and IL-13 in Inflammatory Arthritis. Cells, 10(11), 3000. https://doi.org/10.3390/cells10113000
- Li, N., Liu, C., Luo, Q., Zhang, F., Sheng, D., & Liu, Z. (2023). Correlation of White Blood Cell, Neutrophils, and Hemoglobin with Metabolic Syndrome and Its Components. Diabetes, metabolic syndrome and obesity: targets and therapy, 16, 1347–1355. https://doi.org/10.2147/DMSO.S40808.