miRNA-mRNA Network in PBMCs of PCOS Women Identifies Overactivated Stress-Activated Kinases
bBionivid Technology [P] Ltd., Kasturi Nagar, East of NGEF, Bengaluru, India;
cSAMAD –IVF Hospitals, V.V.Road, Pattoor, Thiruvananthapuram, Kerala, India
Keywords
Abstract
Background/Aims:
Earlier studies have revealed the miRNAs and mRNAs involved in Polycystic Ovarian Syndrome (PCOS), but little is known about their regulatory networks.Methods:
To address this issue, we applied a comprehensive miRNA, mRNA profiling approach in peripheral blood of PCOS patients. We identified 30 differential miRNAs and 3310 differential transcripts. A robust computational framework was created to integrate matched miRNA and mRNA expression profiles in PCOS using feed-forward loops.Results:
The network consisted of differential miRNAs, transcription factors (TFs), and their common predicted target genes. The key network consisted of 14 non-orphan network clusters with 50 TF-gene pairs, 8 TF-TF pairs, 6 miRNA-TF pairs and 36 miRNA- gene pairs which were later dissected into 16 subclusters. Gene ontology annotations revealed that a host of signals (hormone, growth factors –EGF/PDGF, thrombopoietin, oxidative stress and vitamin/nutrition) regulate MAPK signaling altering angiogenesis, JAK-STAT signaling, apoptosis, inflammatory and immune response and steroidogenesis in PCOS women.Conclusion:
MAPK signaling is identified as the syndrome´s major dysregulated pathway. Our data imparts a robust foundation to expand the work and pave the way to focus efforts on p38MAPK targeted therapeutic strategies in PCOS.Introduction
Polycystic ovarian syndrome (PCOS) is the most common metabolic disorder among women of reproductive age. According to National Women’s Health Information Centre (NWHIC) statistics, 5-10% of adolescent women are distressed by its stigma. The disorder is characterized by hyperandrogenemia, chronic anovulation, oligo/amenorrhoea, polycystic ovaries on ultrasound, hirsutism and acne. The individuals are also predisposed to long-term high risks like insulin resistance, type II Diabetes mellitus, obesity, cardiovascular problems, endometrial cancer and reduced fertility. Candidate genes in steroidogenesis [1], insulin signaling [2], gonadotropin action [3], obesity [4] and energy consumption [5] have a positive association with PCOS susceptibility. But it is to be noted that the endocrine, as well as metabolic dysfunction, are only phenotypic endpoints; the ‘cues of induction’ of the syndrome are still evading. This suggests the necessity to comprehend how these critical factors act in an interdependent way at the pathway level rather than at the candidate molecular level.
Additionally, to study the complex molecular mechanisms it is important to explore the underlying gene regulation. The primary regulatory modules of gene expression in the genome are Transcription Factors (TFs), which control individual gene transcription through interacting with specific recognition DNA motifs at the cis gene promoter regions. Another class of regulators viz., MicroRNAs (miRNAs) control gene expression at the post-transcriptional level. They are small (19-22 nucleotides), endogenous, non-coding RNAs, regulating gene expression by targeting 3’ UTR of mRNAs. miRNA’s express in a tissue-specific, stage-specific and disease-specific manner and play a pivotal role in development, differentiation, immunogenesis, hematopoietic cell differentiation, apoptosis, cell proliferation and organ development [6]. Persuasive shreds of evidence have accumulated on the regulatory role of noncoding miRNAs in biological development as well as disease pathology. Although reports exist of global miRNA profiling in PCOS in follicular fluid [7, 8]and serum [9, 10], no systemic global analysis of miRNAs has been endeavored to identify their regulatory networks under PCOS.
Being regulatory factors with a common functional logic, TFs and miRNAs can synergistically regulate the same gene: while transcriptional control by TFs occurs at the gene’s promoter region, miRNAs’ post-transcription control occurs at the gene’s 3’ untranslated region (UTR). In a biological system regulation of gene expression at two distinct functional levels by TFs and miRNAs are tightly coupled [11]. Another important perspective is that miRNAs act with greater strength to modulate their target expression at different levels when in concert with other regulatory motifs such as TFs. Stemming from these conditions we focused our attention on the existence of a particular class of local regulatory circuits in the biological system in which a TF regulates a miRNA and vice versa and either jointly or separately target a set of protein-coding genes. These kind of transcriptional/post-transcriptional circuits are called mixed miRNA/TF Feed-Forward Loops (FFLs). A standard mixed FFLviz., 3 node FFL contains 3 components; TF, miRNA and target genes. Thus FFLs in a cellular system act as a functional unit and enable us to understand intricate biological events, controlling the cell fate. In recent years, the dynamic of FFL has been broadly approached since this regulatory pattern recur in biological networks compared to random networks [12, 13] and thus represents evolutionally preferred functional building block. FFLs linking miRNAs and genes allow us to achieve target gene tailoring and noise buffering [14, 15]. In a work by Tsang et al. [13], the correlation between miRNA host genes and target mRNAs was assessed together with conserved 30 UTR motifs to define putative regulatory relationships between a miRNA and a set of target genes sharing the same TF. This type of regulatory biological network has not been investigated in PCOS to date.
Thus, our study aimed to explore the differential expression of miRNAs and mRNA transcripts in peripheral leukocytes of PCOS patients and identify the complex regulatory subcircuits explicitly connecting TF and miRNAs involved under PCOS. We performed global expression profiling of miRNA and mRNAs in PCOS peripheral blood which revealed the specific miRNAs and gene signature. A computational approach including a web interface was employed to create a feed-forward network with the TFs, differential miRNAs and mRNAs and key pathways were identified.
Materials and Methods
Statement of Ethics (both Discovery and Validation Cohorts)
The study was approved by Rajiv Gandhi Centre for Biotechnology’s Institutional Ethical Committee (IHEC/2/2009/13) and SAMAD IVF Ethical committee. Prior written consent was obtained from all participants after a full explanation of the purpose and nature of all procedures used, in accordance with the Declaration of Helsinki from all the subjects before the collection of samples.
Subject Recruitment, Peripheral blood sample collection
The study group included PCOS patients recruited from SAMAD IVF Hospital, Thiruvananthapuram and age-matched controls selected from the volunteers. The PCOS patients were diagnosed based on the presence of two out of three criteria including oligo- and/or anovulation, clinical and/or biochemical signs of hyperandrogenism and polycystic ovaries according to the Rotterdam European Society for Human Reproduction and Embryology (ESHRE)/American Society for Reproductive Medicine (ASRM)-sponsored PCOS Consensus Workshop Group [16]. Patients with other possible causes of anovulation or hyperandrogenemia were excluded from the study. Regular cycling women devoid of visible signs of hyperandrogenemia or acne and with no history of endocrine disorders were selected as normal controls. The patients were enrolled in the hospital for infertility treatment and were experiencing oligo/anovulation manifested as oligomenorrhea (>35 days apart). Diagnosis of PCOS was based on the presence of more than 12 peripheral ovarian follicles of less than 7mm diameter, increased ovarian volume and dense ovarian stroma. The patient and control characteristics are summarised in Table 1. All values are expressed as mean+ standard deviation.
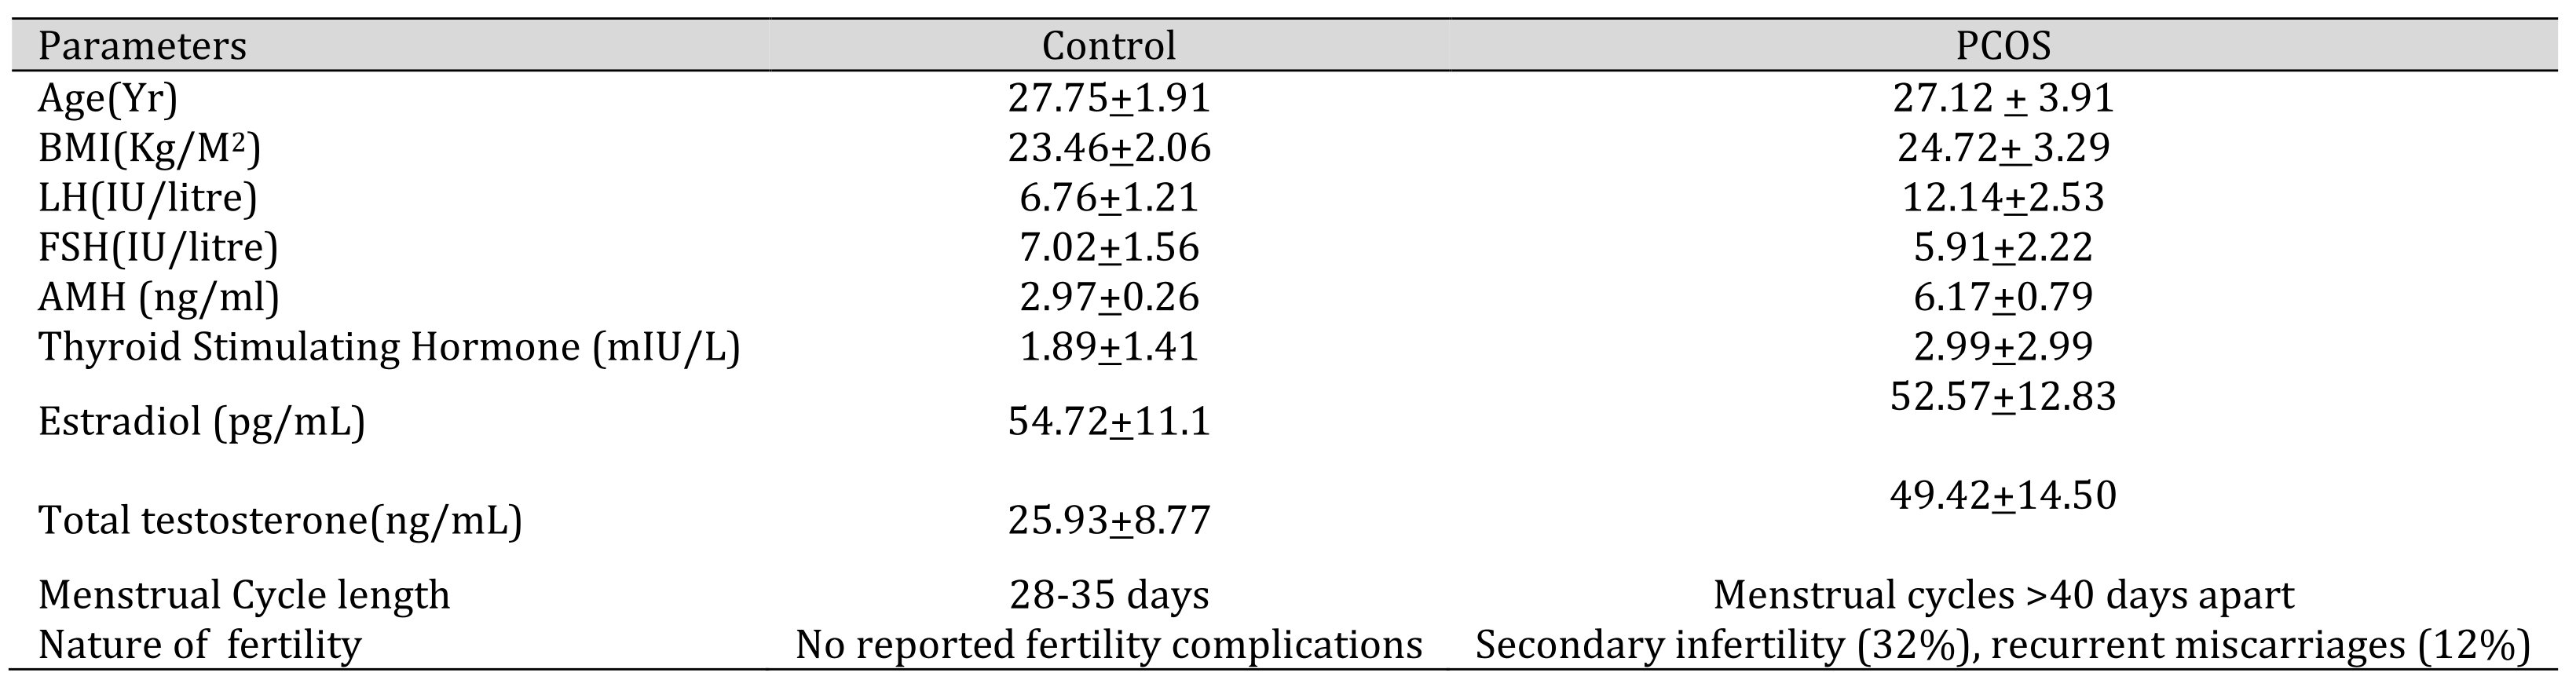
Table 1: Clinical, biochemical and physiological characteristics of PCOS patients. The values are expressed as mean+ SD
Sample size calculation.
Sample size calculation for this study was based on the hypothesis that when allocated at a 1:1 ratio of control: PCOS, 30% of control and 80% of PCOS will show the change in expression of miRNA-mRNA levels with 80% power and 95% confidence level and was performed using OpenEpi free online facilities (http://www.openepi.com/SampleSize/SSMean.htm). As more variations were expected in the PCOS group we recruited 25 PCOS subjects for the study which was exceeding the obtained sample size of 16 in each group.
Blood sample collection and RNA isolation
Venous blood was collected in EDTA-coated tubes from the study subjects. Total RNA with small RNAs was extracted from the samples using miRNeasy mini kit (Qiagen) according to the manufacturer’s instructions. The RNA samples were quantified using an ND-1000 spectrophotometer (Nano-Drop Technologies, Wilmington, DE). The purity and integrity were assessed on Agilent 2100 bioanalyzer with the RNA 6000 Nano LabChipR reagent set (Agilent Technologies, Germany). Only RNAs with no signs of DNA contamination and appreciable RNA integrity number (RIN) value (>7) were down-processed.
TaqMan miRNA Low-Density Array
TaqMan Array Human MicroRNA Panel v 1.0 (Applied Biosystems, Foster City, CA) was used for miRNA expression profiling and is detailed in the supplementary methods section.
miRNA expression analysis
The raw Ct values were extracted using SDS v2.3. Ct distribution among samples was scrutinized for variation. TaqMan(R) real-time data was analyzed using DataAssistTMv2.0 software (Applied Biosystems Inc, CA) as detailed in Supplementary Methods.
Transcript expression profiling by microarray
Gene expression microarray analysis of peripheral blood samples from normal (n=4) and PCOS patients (n=4) was performed using Illumina’s HumanHT-12 v4 Expression BeadChip array. 500 ng of total RNA was used for cDNA synthesis, followed by an amplification/labeling step (in vitro transcription) to synthesize biotin-labeled cRNA. Sample labeling, hybridisation, and scanning were performed) according to the manufacturer’s instructions (Illumina, Inc., San Diego, CA). To export gene expression data based on unique genes, we used the Sample Gene Profile option of Illumina BeadStudio software. The whole 48803 probes on the Human-Ht12 beadChip ver. 3 were used.
Microarray Data Analysis
Raw data obtained in .chp and .cel files were normalized using GeneSpring GX v 12.0. Intra-array normalization was done by Quantile normalization for each chip/sample. Inter array normalization was done by taking the median of all the samples. The volcano plot-based method was used to find out genes that are 2 fold differentially expressed between the 2 conditions (Patient Vs Controls) by applying Unpaired Student T-Test for p-value calculation (p <0.05) and Benjamini Hochberg-based FDR correction. Hierarchical clustering of differentially expressed genes was done by Pearson Uncentered algorithm with Average linkage rule to identify up and down-regulated gene clusters.
RT-PCR for miRNA and mRNA for validation of the array differential expression
Individual miRNA and mRNA real-time PCR for selected miRNAs/mRNA was performed as detailed in Supplementary Methods.
Construction of FFL
The differential miRNAs were uploaded and the putative targets were predicted using combinatorial analysis by miRWalk (http://www.ma.uniheidelberg.de/apps/zmf/mirwalk). The differentially expressed targets (fold change, 1; p-value 0.05) were identified by compiling the gene expression microarray. The list of Human TFs and human miRNA/TF singular circuits wasdownloaded fromCircuitsDB (http://biocluster.di.unito.it/circuits). We generated the following pairs: TF regulating gene (TF-gene) or miRNA (TF-miRNA), miRNA inhibiting gene (miRNA-gene) or TF (miRNA-TF). We then performed a target enrichment analysis and selected highly enriched TFs and miRNAs. Further Cytoscape V 8 was used to model the integrative network of the circuits with emphasis to proteins that are significantly connected to the network to understand their role and significance. Later the network was dissected with cluster-Maker was applied to the integrative network.
Gene ontology and pathway analysis
Biological analysis of differentially expressed genes was done for Gene Ontology and Pathways using the DAVID tool (http://david.abcc.ncifcrf.gov/). Statistically, significant ontologies and pathways were filtered based on p-Value <0.05 (Obtained using Fischer Exact Test) with Benjamini-Hocheberg FDR correction. Pathway Analysis was executed with the aid of DIANA -mirPath (http://diana.cslab.ece.ntua.gr/pathways). Semantic analysis on (http://www.gopubmed.org) was performed as a text-mining tool. The flowchart illustration showing the steps involved in this study is shown in Fig. 1.
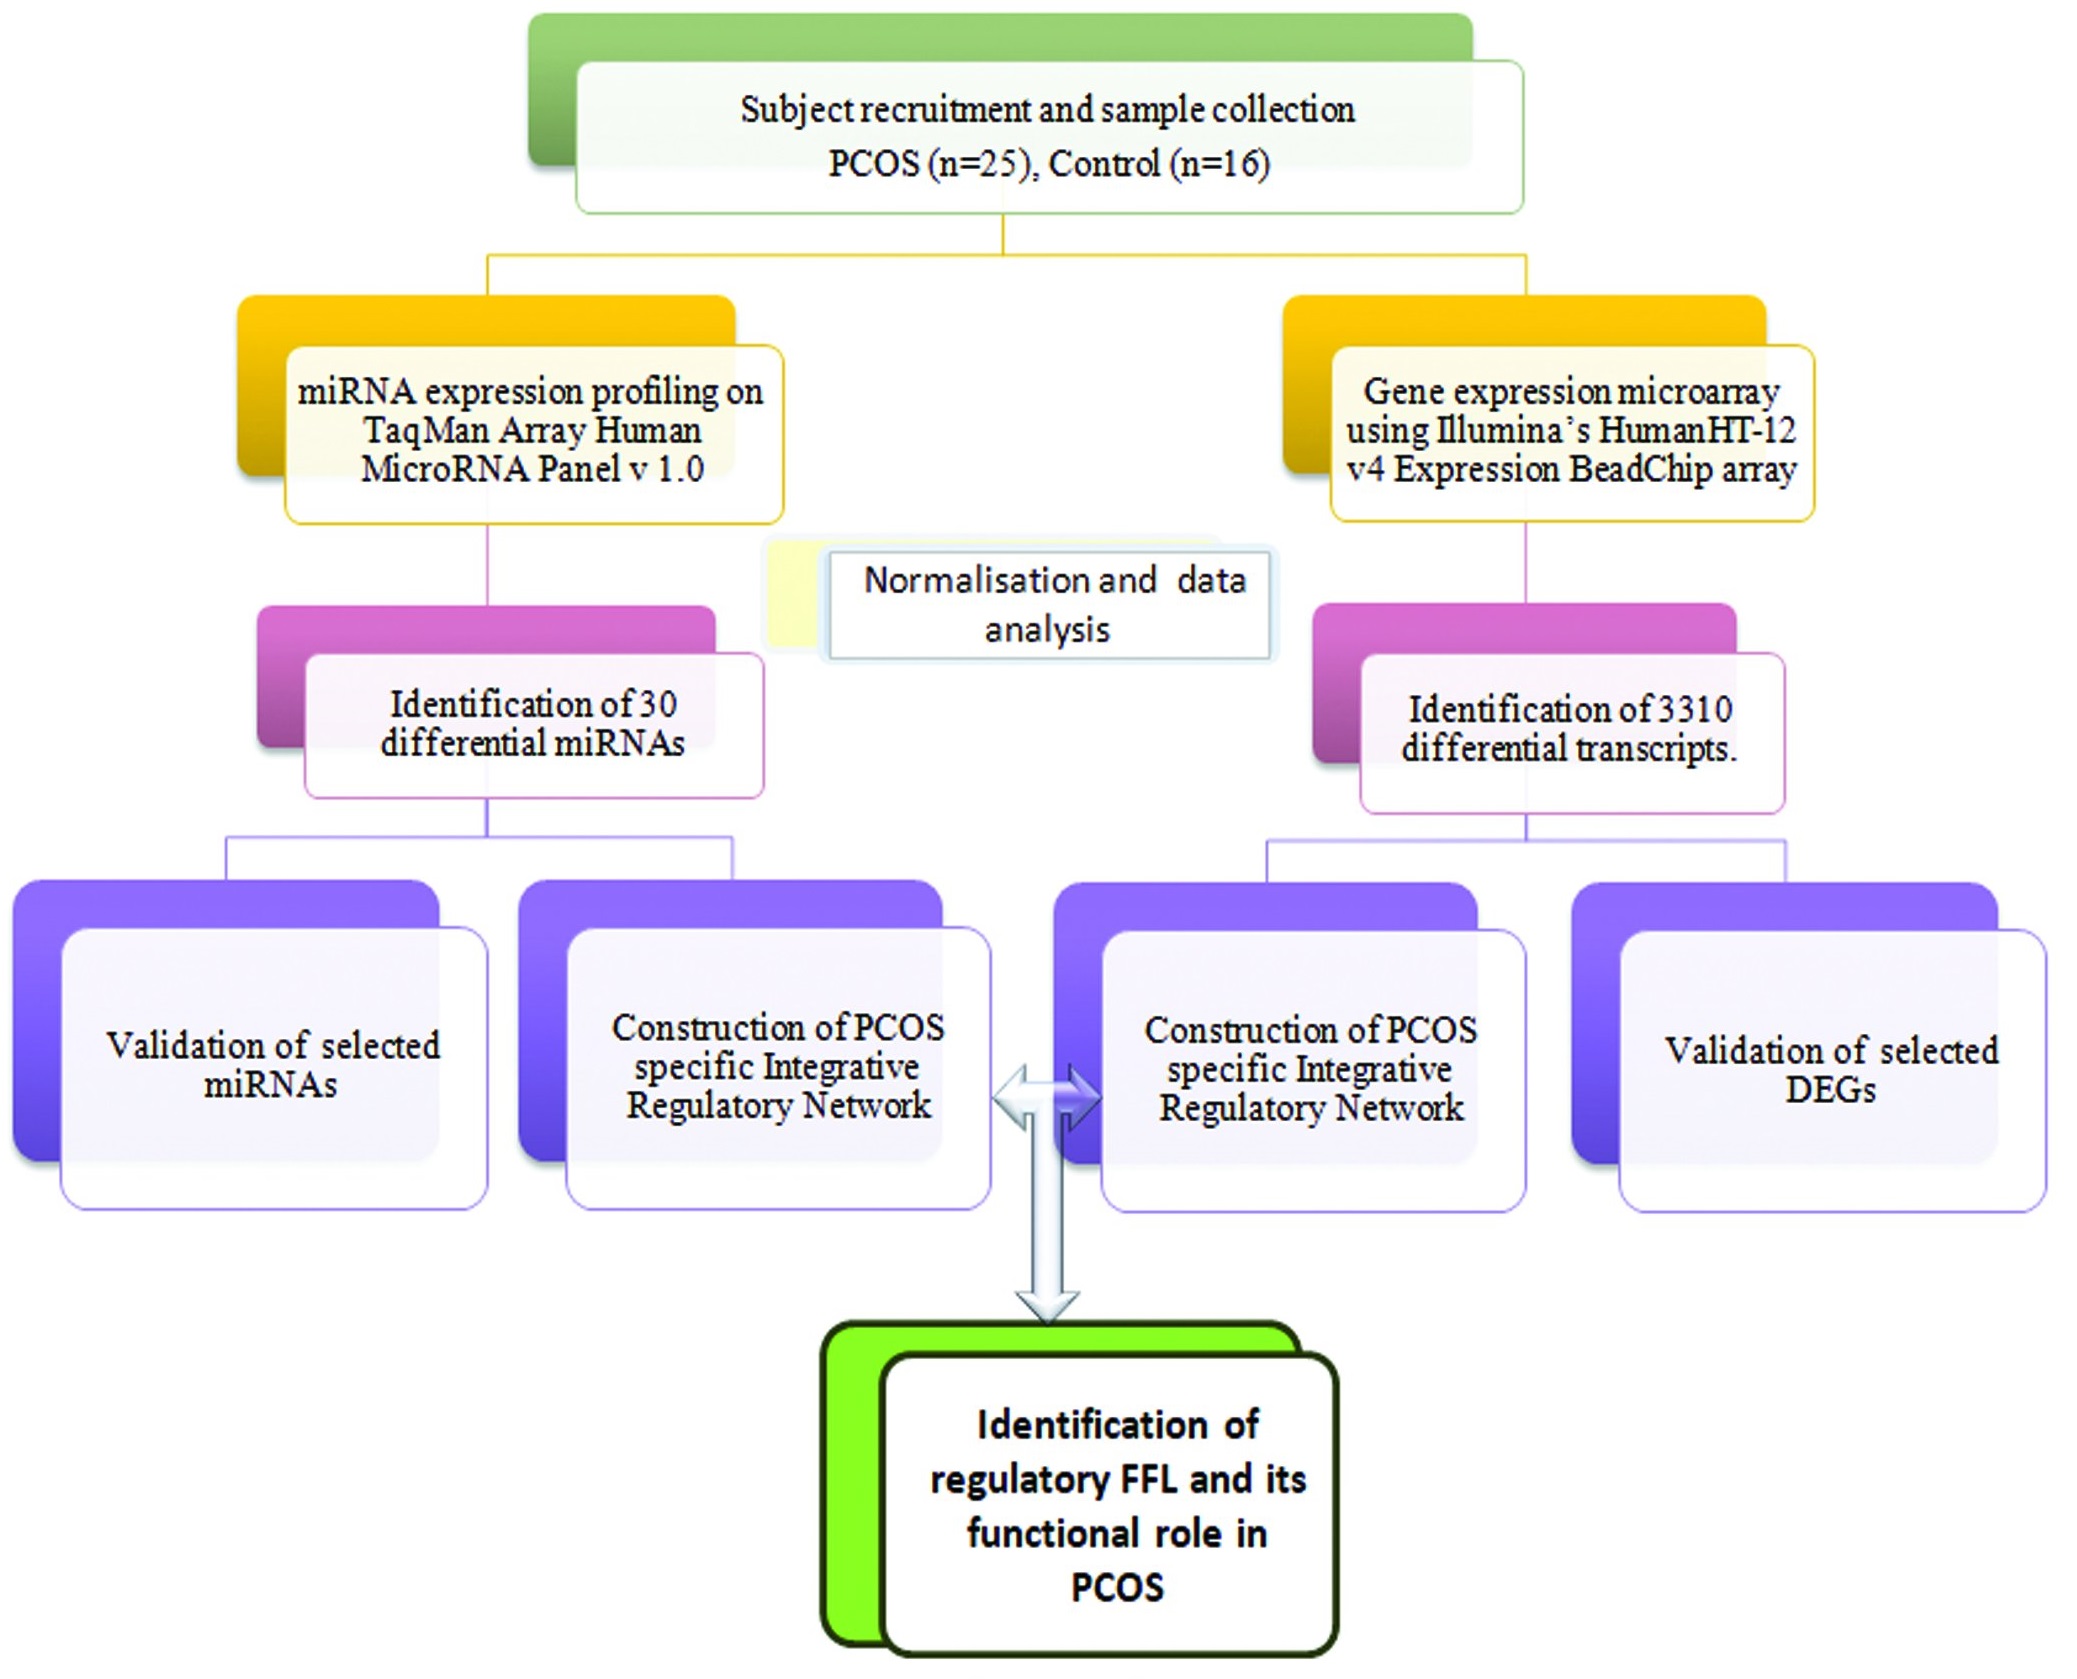
Fig. 1: The flowchart illustration of steps involved in this study.
PBMC isolation, protein extraction and Western blot analysis
Peripheral blood mononuclear cells (PBMC) from all participants were isolated as described elsewhere, by Ficoll-density gradient centrifugation [17]. Protein isolation from PBMCs and western blotting was performed as described in Supplementary Methods.
Statistical Analysis
Student t-test analysis was used for comparisons between two groups and data analyses were performed with GraphPad Prism 6.0 (GraphPad Software Inc.) and Excel Data analysis (Microsoft, Seattle, WA). Results were represented as mean ± SD. P values less than .05 were considered to be statistically significant.
Results
Multiple microRNAs are differentially expressed in the peripheral blood of PCOS patients
a. Discovery Phase
To identify the miRNA signature of anovulatory PCOS, we performed global real-time expression profiling with peripheral blood samples from 4 PCOS patients and 4 age-matched controls on days 2-4 of the follicular state using the TLDA platform (Applied Biosystems, CA) (See Materials and Methods for details) on an array preloaded with probes for 365 functional miRNAs. TLDA results of miRNA profiling have been submitted to the GEO database (http://www.ncbi.nlm.nih.gov/geo/query/acc.cgi?acc=GSE54249). The heat map representation of the clustering is shown in Fig. 2A. 10 miRNAs were up-regulated (>1fold) and 20 were down-regulated (<1 fold) on a logarithmic scale (See Table 2).
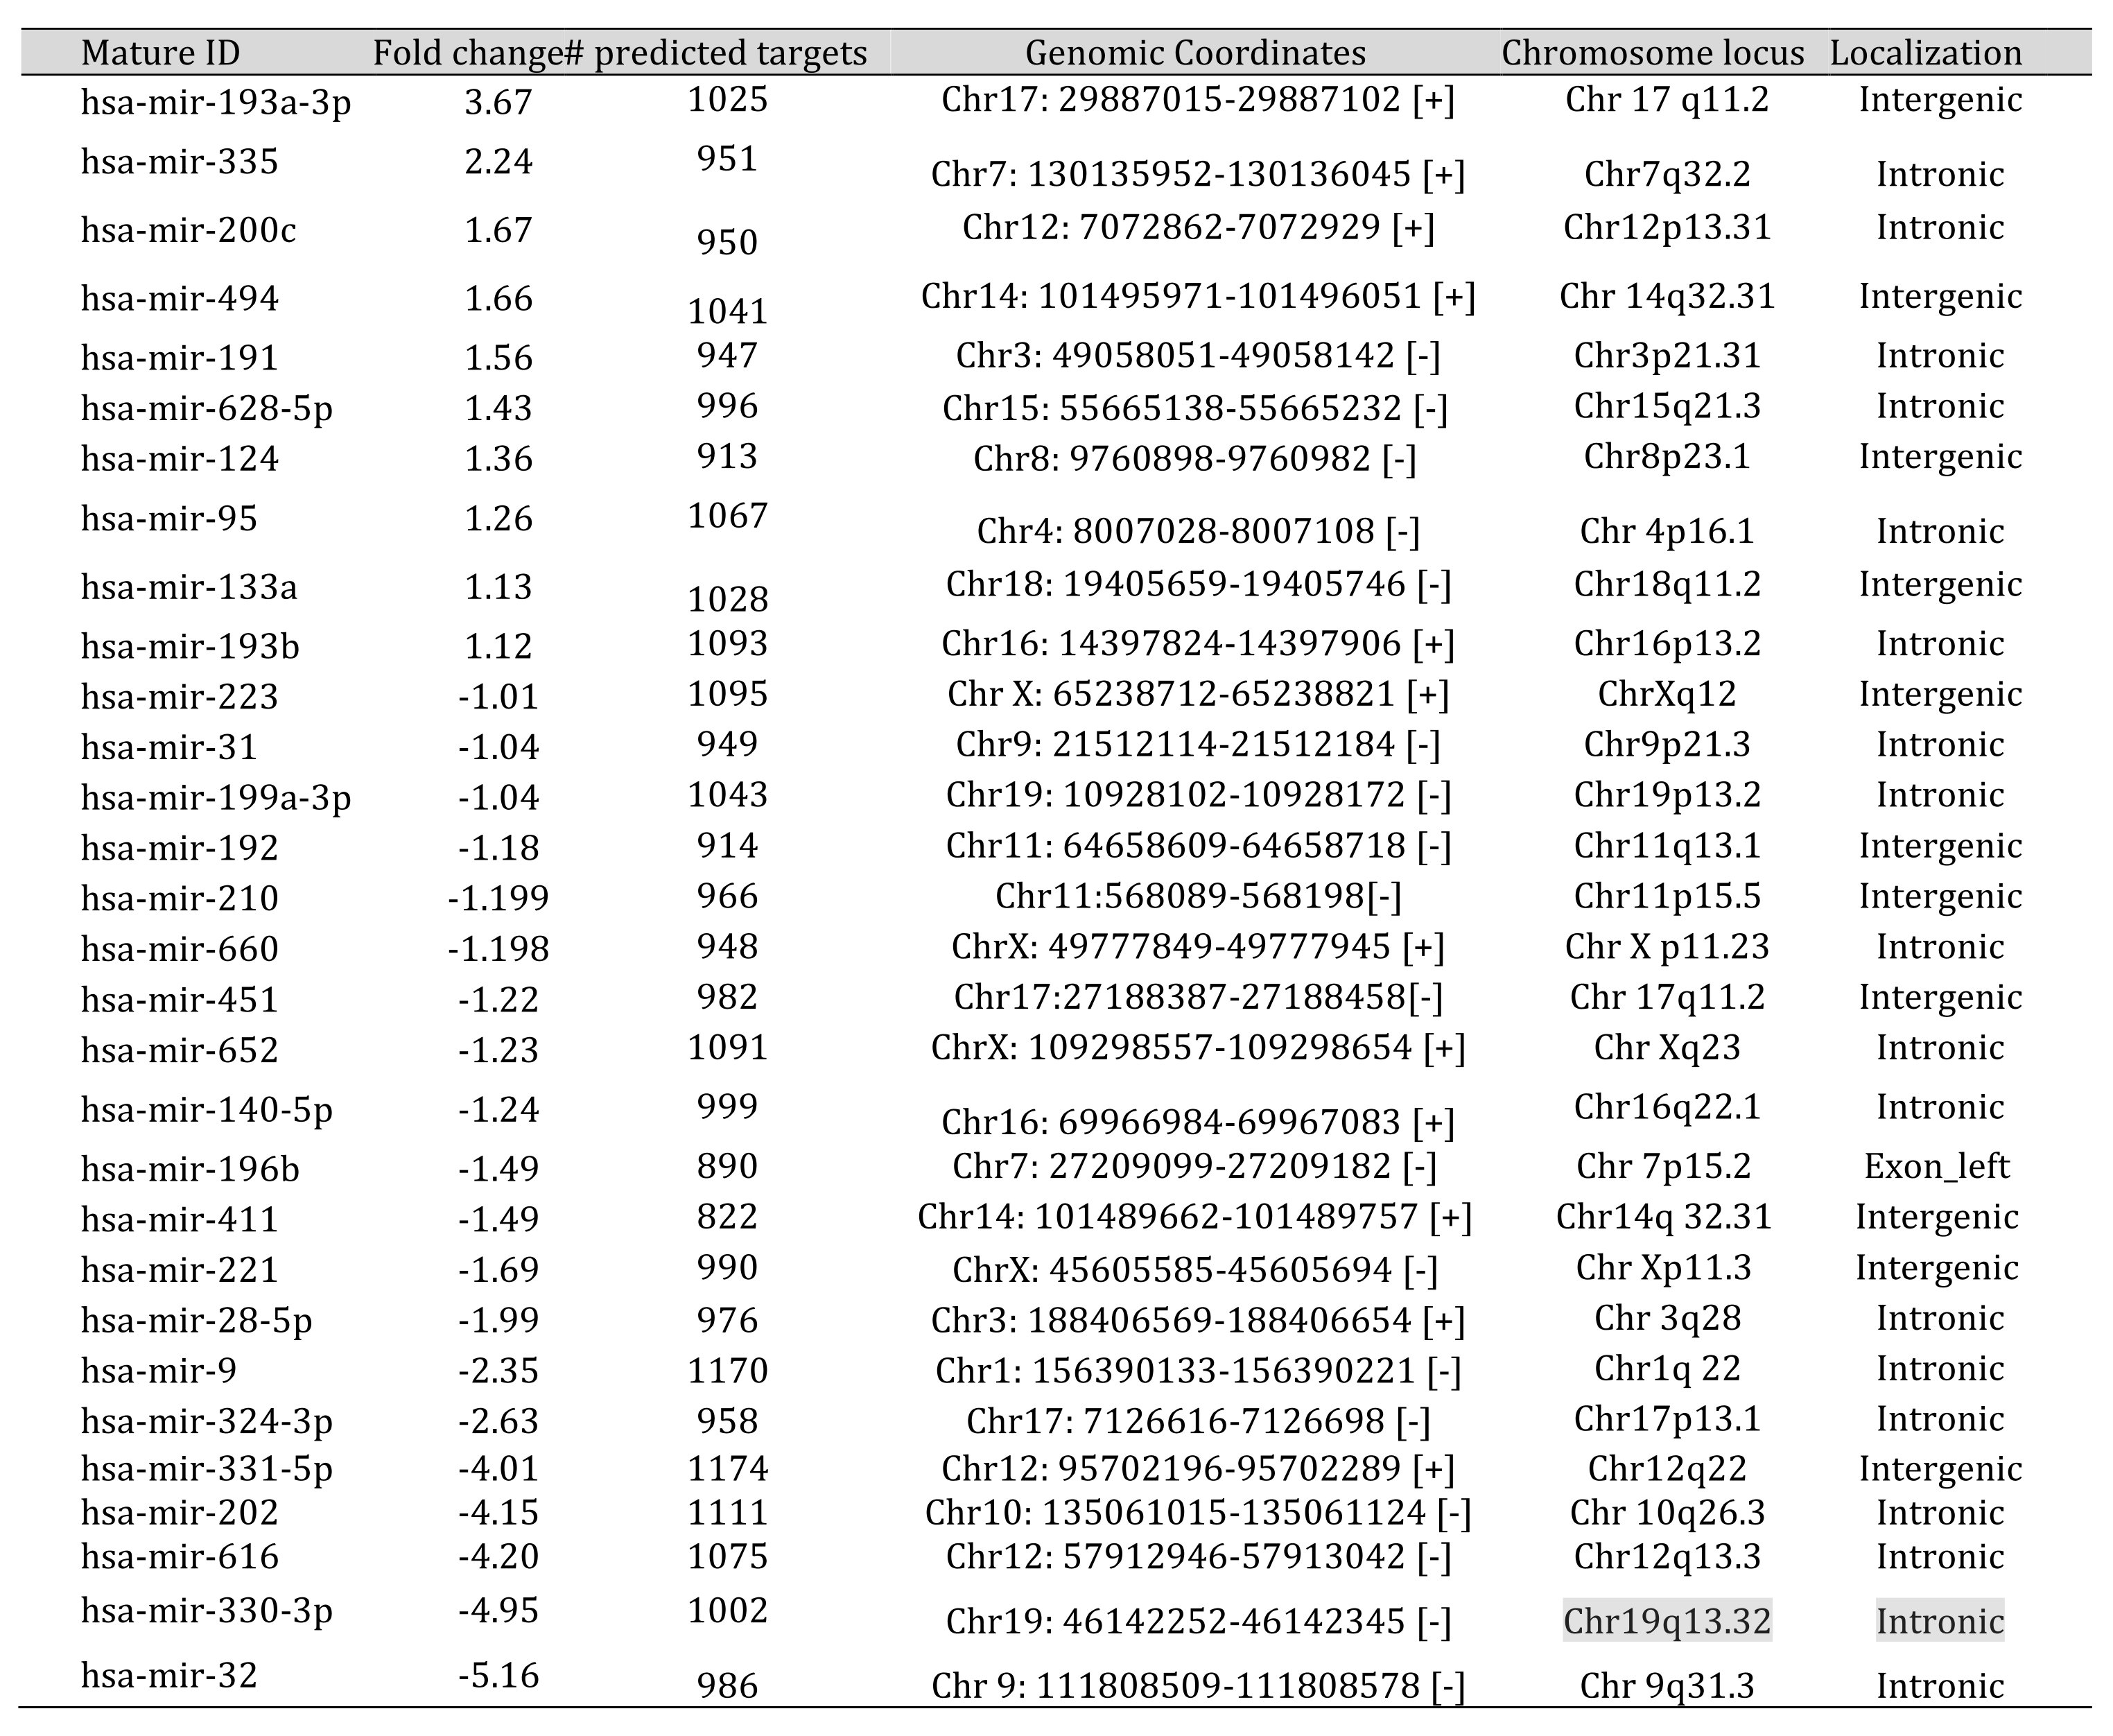
Table 2: The Differentially expressed miRNAs in peripheral blood of PCOS patients. The differential miRNAs with one fold change (log2RQ) in either of the direction. The targets are predicted with miRWalk and the chromosomal localization using coGemiR and Ensembl
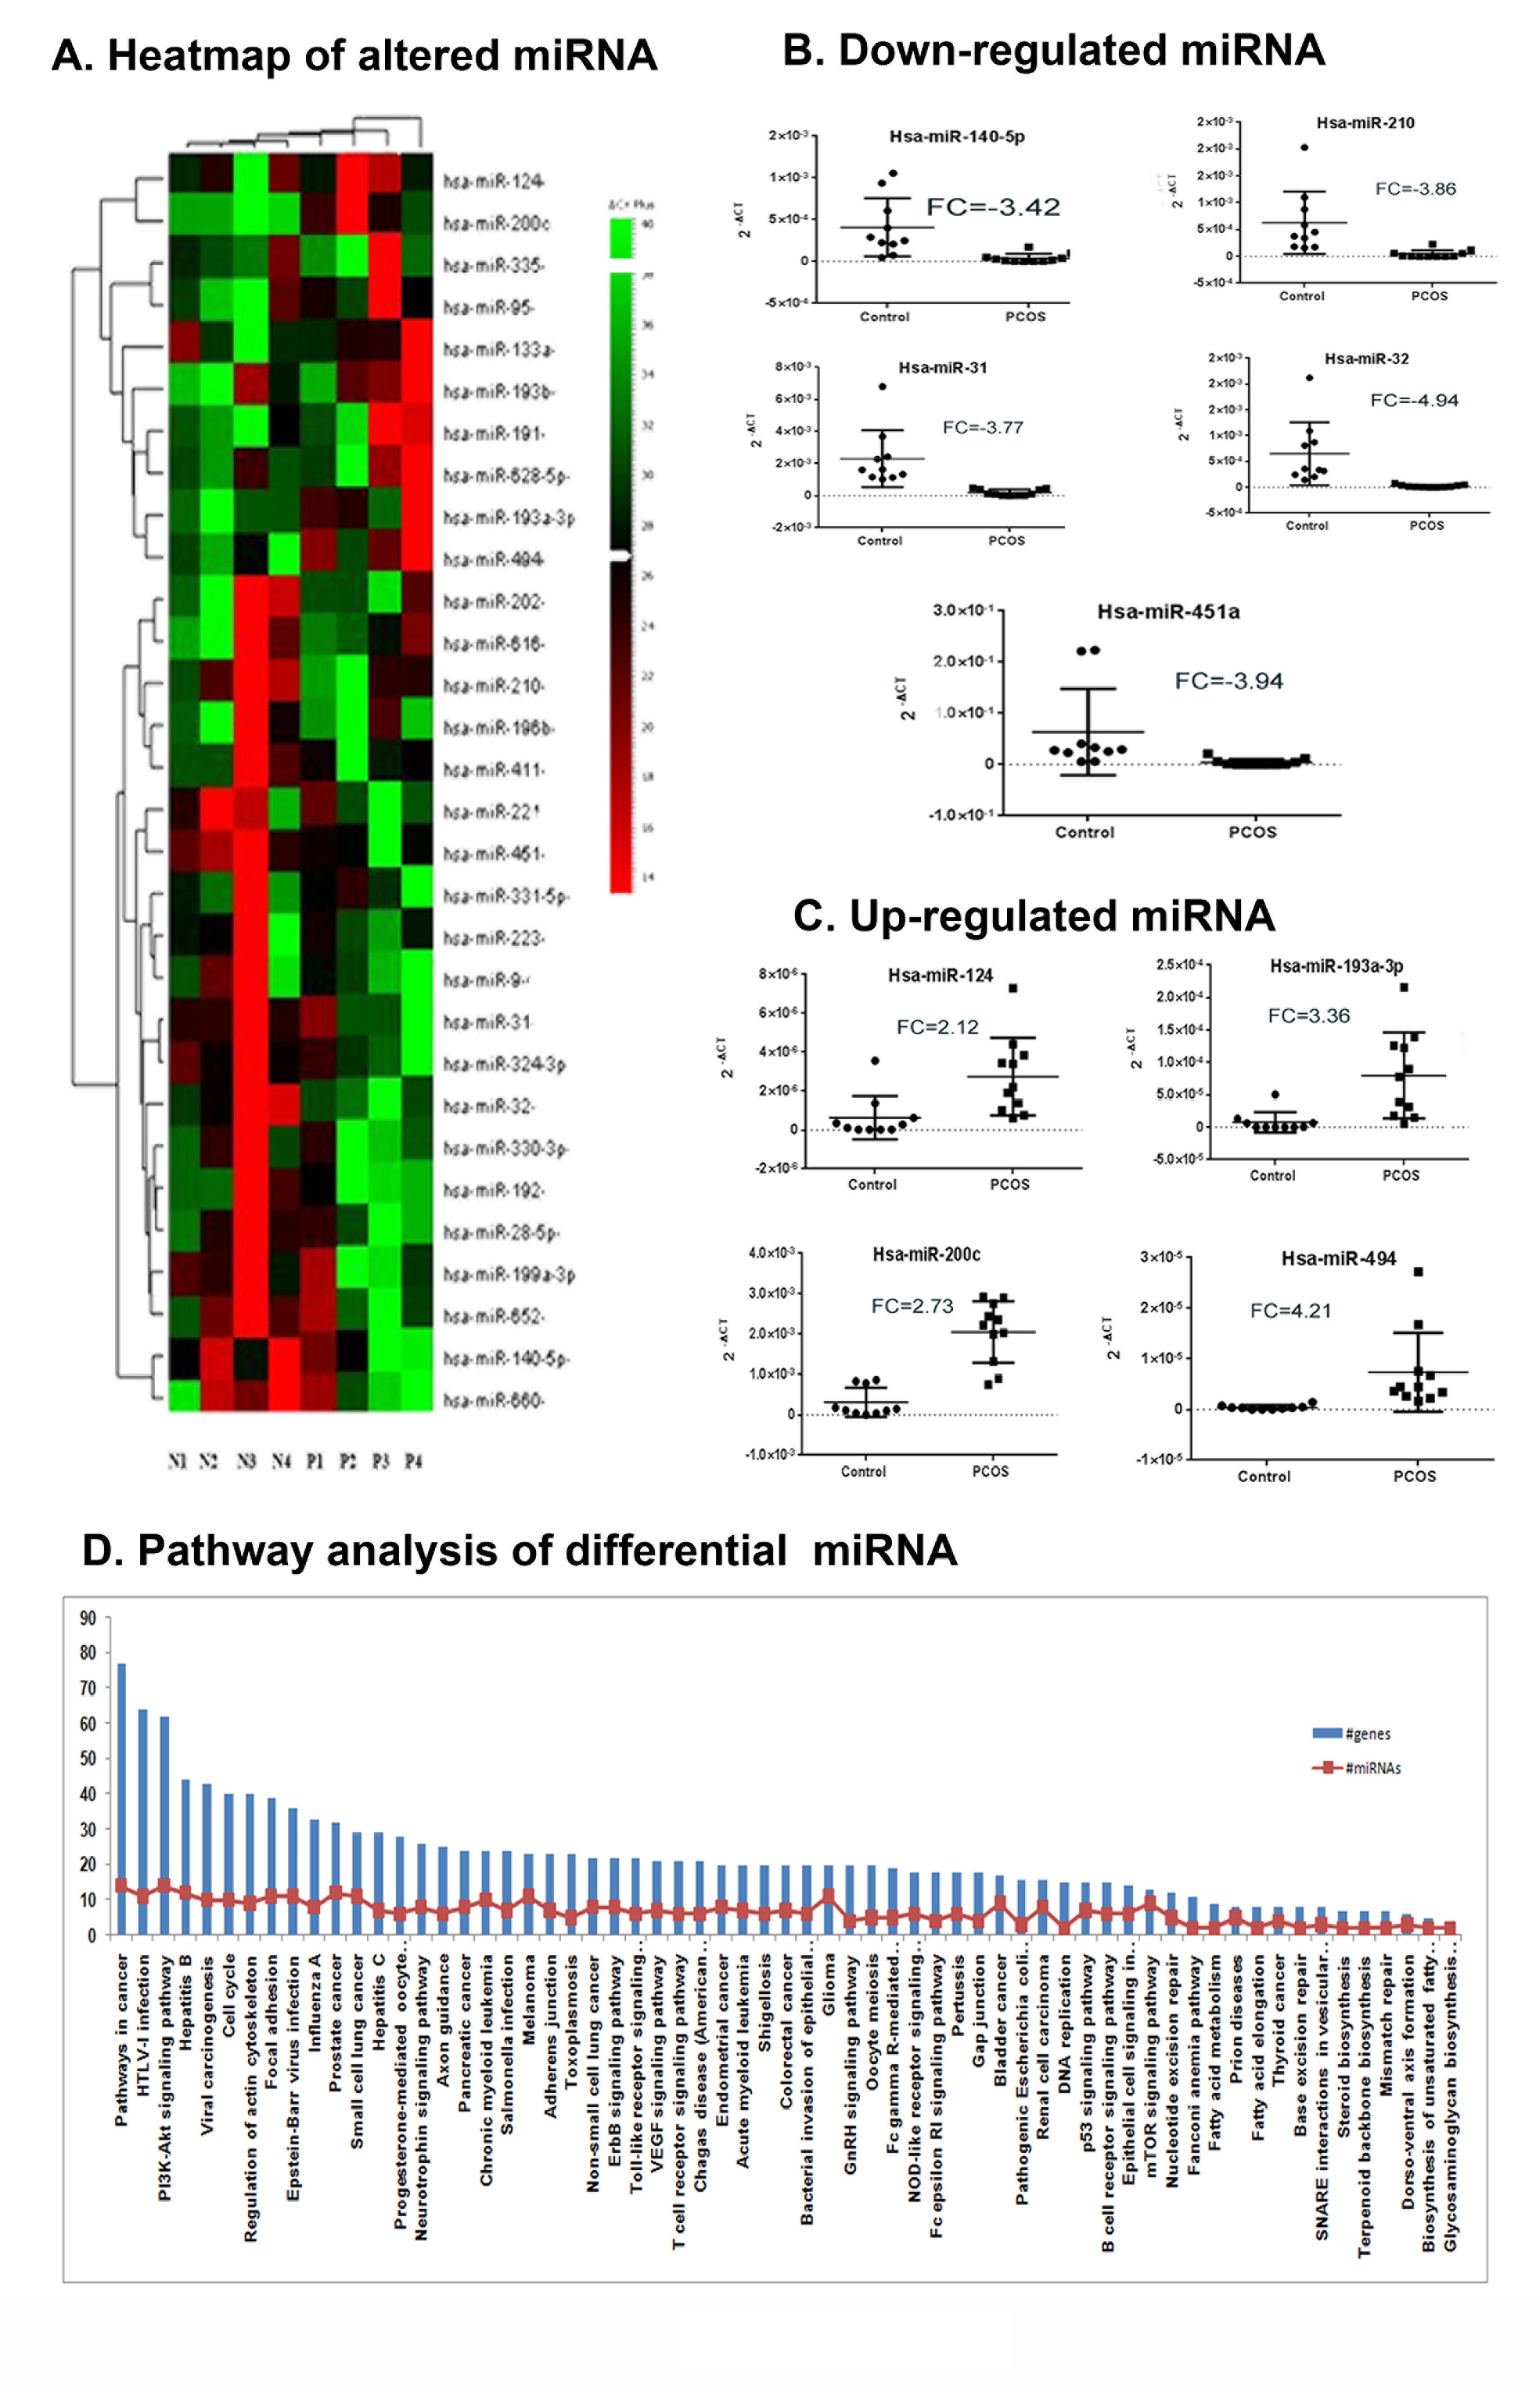
Fig. 2: PCOS peripheral blood specific differential miRNA profile. A) Heat map representation of the differential microRNAs in peripheral blood of PCOS patients (n=4, P1-P4) and control subjects (n=4, N1-N4). The columns represent the source of the samples either PCOS or control and the rows represent the differentially expressed miRNAs. Red and green colours indicate up and down regulation respectively relative to the overall mean for each miRNA. Relatedness in miRNA expression across the samples is shown by the hierarchical tree on the Y axis through standard linkage. B) Real time validation of the differentially down regulated miRNAs. C) Real time validation of the differentially regulated miRNAs. For both B) and C) the Fig. comprises of the dot plot representation of the relative expression of selected miRNAs across the samples. The 2-∆Ct values are plotted in Y axis of dot plots. The RQ (2-∆∆Ct) was calculated according to ∆∆Ct method using 5SrRNA as the endogenous control. Fold Change (FC) is represented as log2RQ. A single real time experiment was performed for each subject and miRNA, with the miRNAs run in triplicates. Statistical analysis was done using Graphpad Prism 6.0. D) Pathway Analysis showing pathways enriched with transcripts targeted by the differential miRNAs. The differential pathways are categorisedon the basis of –ln P value and the Y axis represent the number of targeted transcripts. The numbers of differential miRNAs involved in each pathway are shown as red dots in each bar. (*p-value ≤ 0.05 and **p-value ≤ 0.01).
b. Validation phase
To validate the expression profiling results, quantitative real-time PCR was performed on selected miRNAs in a population of 21 subjects (N=10, P=11). The individual miRNA expression assay results showed a decrease in hsa-miR-140-5p , hsa-miR-210 , hsa-miR-31 , hsa-miR-32 and hsa-miR-451 and increase in hsa-miR-124 , hsa-miR-193a-3p ,hsa-miR-200c and hsa-miR-494 and these results are in absolute agreement with the TLDA findings at a significance level of p-value<0.05 (Fig. 2 B-C). This indicated the reliability of the expression profiling data.
c. Analysis phase
Chromosomal location analysis : Our analysis of the chromosomal locations of the 30 miRNAs revealed that 18 miRNAs (60%) were intronic and 11 miRNAs (36.67%) were intergenic (Figure S2). Hsa-miR-196b was shown to have an exon-left type of localization. A set of 2 miRNAs (6.67%) were clustered on to specific chromosome loci of Chr14q32.31 and Chr17q11.2. Maximum number of miRNAs 4 (13.3%) were clustered on Chromosome X (Table 2).
Pathway analysis:
To interpret the functional significance of these differential miRNAs, we performed gene-pathway analysis on DIANA miR-Path which identified targets for the altered miRNAs in PCOS and integrated them into 69 KEGG pathways (based on – ln P-value) (The top 25 pathways were represented in Fig. 2D). The major molecular networks enriched with targets of the altered miRNA set were MAPK signaling, actin cytoskeletal regulation, focal adhesion, adherens junction, TGF β signaling, axon guidance, insulin signaling, tight junction, cytokine-cytokine receptor interaction and ErbB signaling (See Supplementary Data File S1 for the complete list of pathways).
d. Diagnostic value of peripheral blood miRNAs for PCOS
To evaluate the diagnostic values (through specificity and sensitivity) of the validated miRNAs, we performed a Receptor Operative Characteristic (ROC) analysis. The results indicated high diagnostic values for hsa-miR-31, hsa-miR-32 and hsa-miR-494 with a perfect AUC (Area Under the Curve) value of 1. Other than hsa-miR-124 (AUC=0.89), all the miRNAs (hsa-miR-140-5p, hsa-miR-210, hsa-miR-451a, hsa-miR-193a-3p and hsa-miR-200c) had excellent AUC values (0.9-0.99) proposing their efficiency as predictor tool for PCOS (Fig. 3).
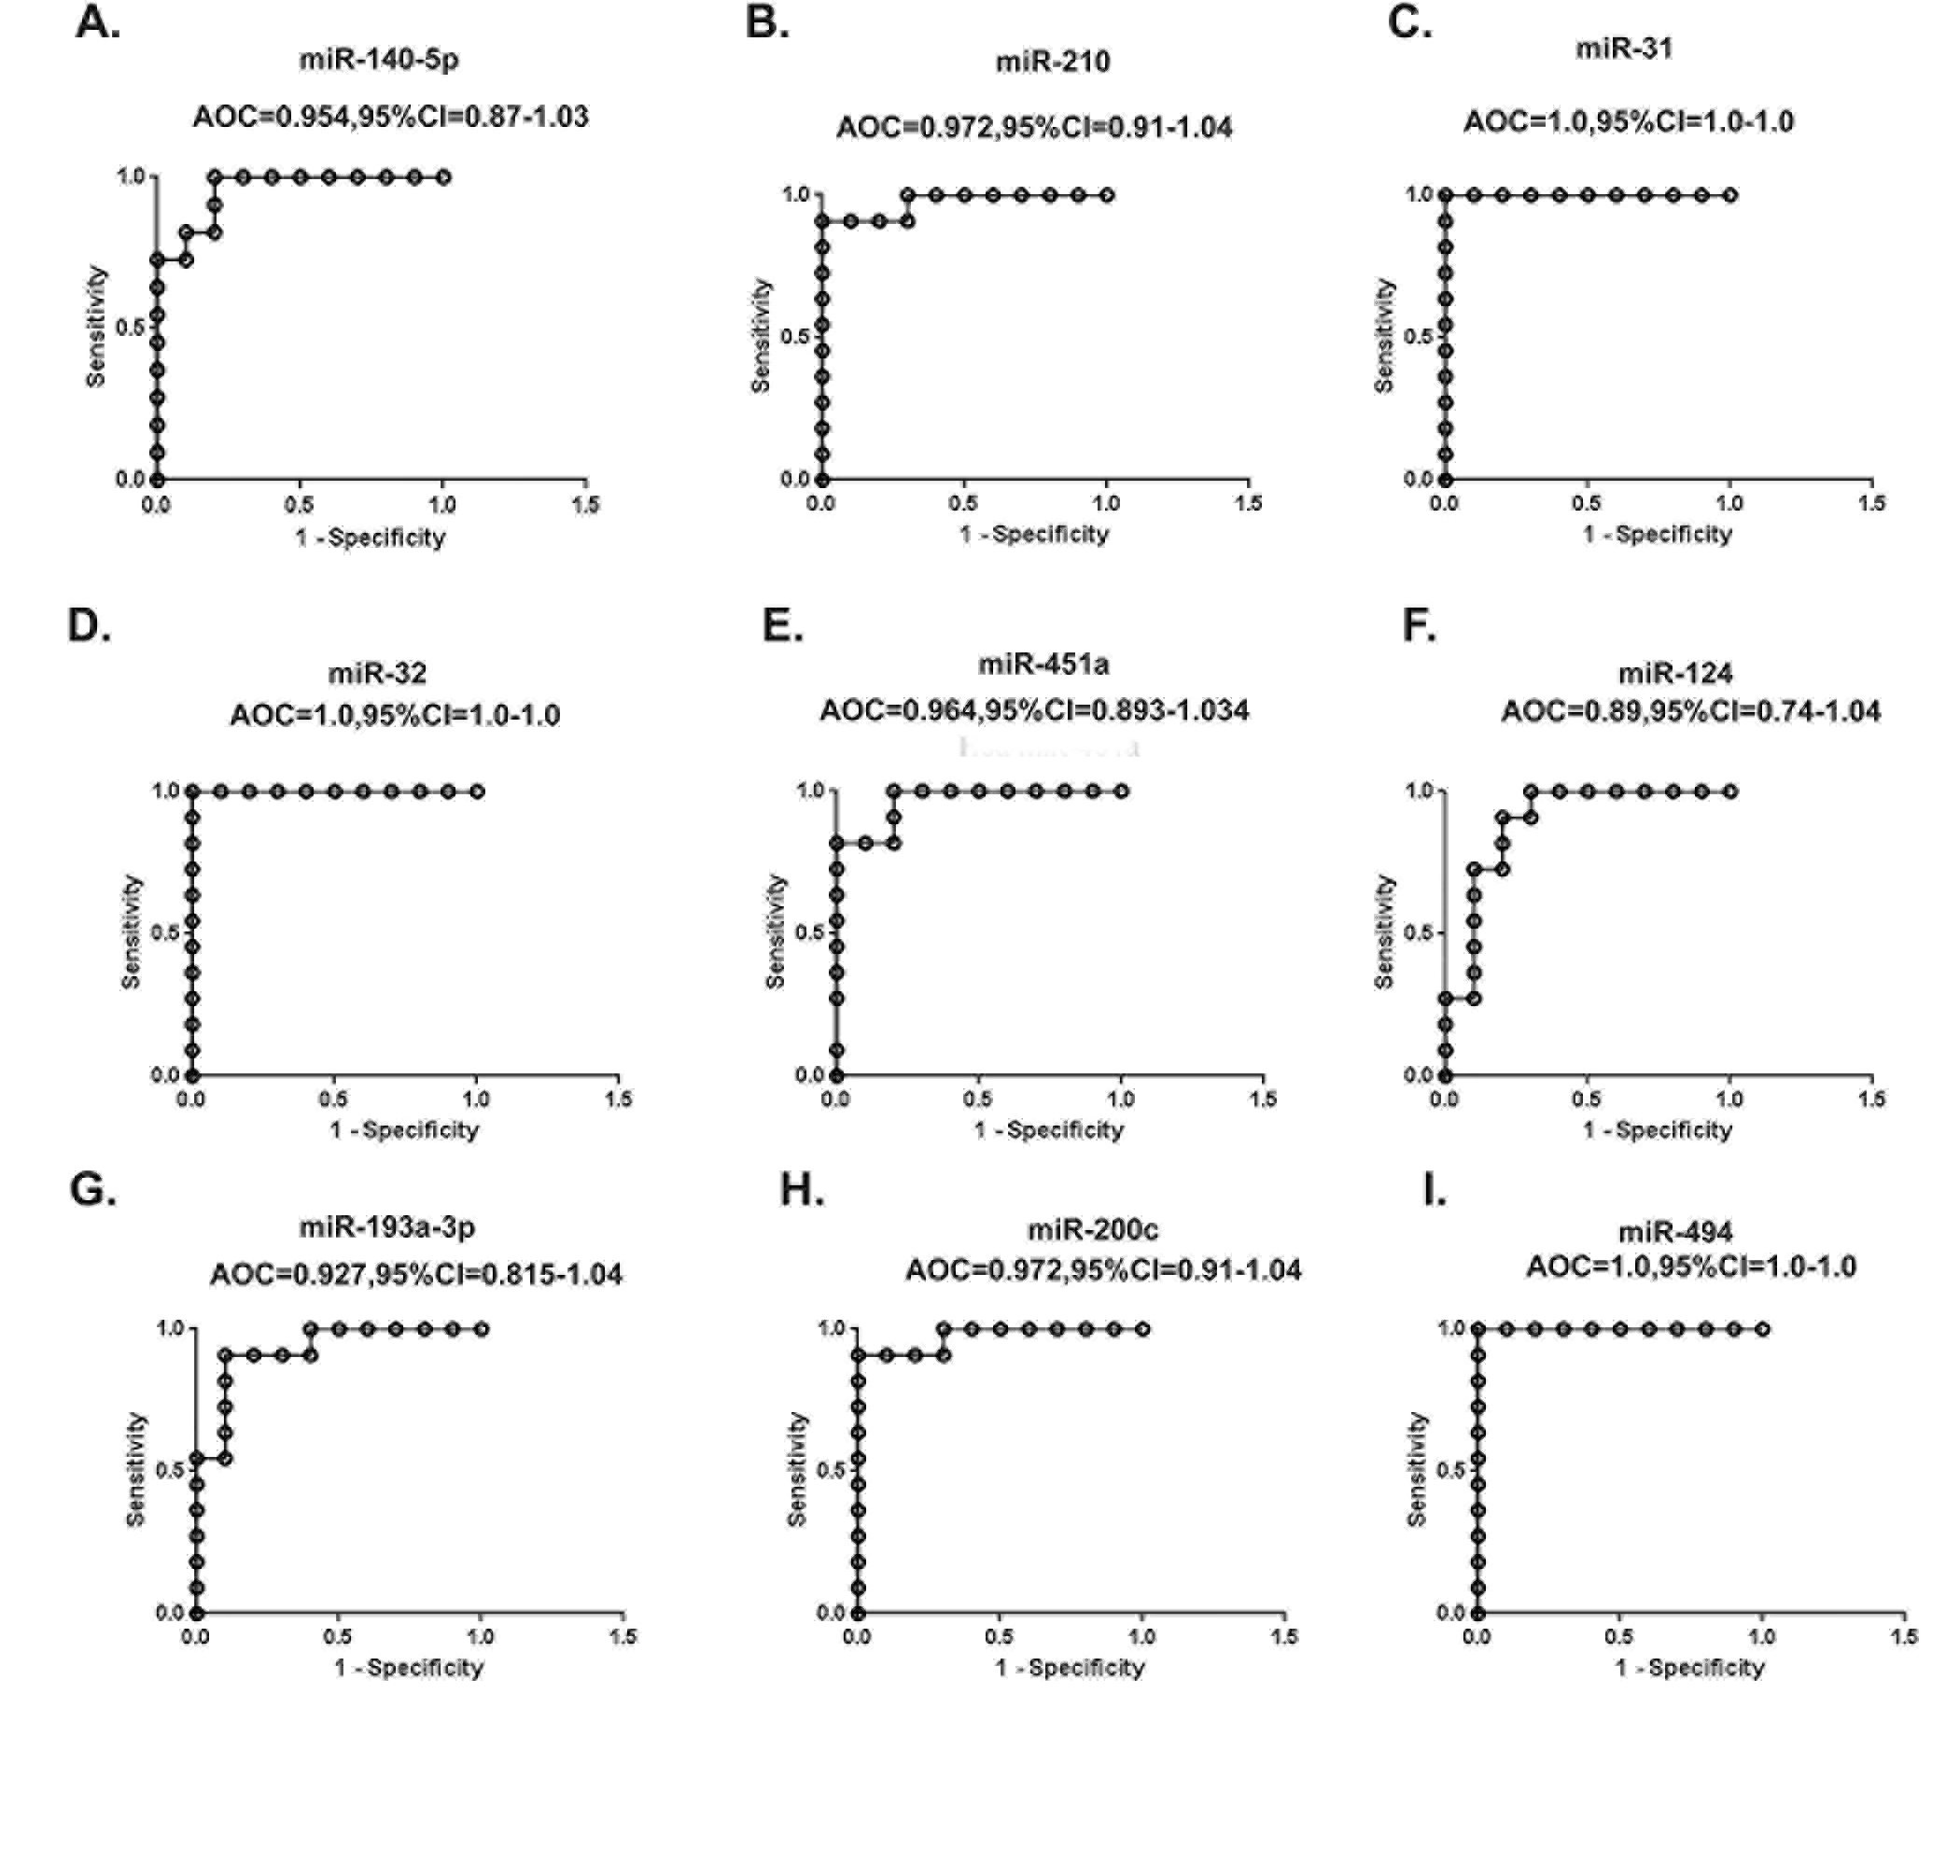
Fig. 3: ROC curve analysis of the validated miRNAs. Area under curve of receiver operating characteristic (ROC) for A) miR-140-5p,B) miR-210, C) miR-31, D) miR-32, E) miR-451a, F) miR-124,G) miR-193a-3p, H) miR-200c, I) miR-494. Three miRNAs (miR-31, miR-32 and miR-494 yielded largest area under the ROC curve (AUC).
Altered gene expression profile in PCOS peripheral blood
a. Discovery Phase
Gene expression profiling on the Illumina expression microarray platform was necessary to enable us to assess any correlation present between the miRNA and mRNA differential expression in PCOS. Microarray results of mRNA profiling have been deposited in the GEO database (http://www.ncbi.nlm.nih.gov/geo/query/acc.cgi?acc=GSE54248). Signal correlation plot, Principal Component Analysis and volcano analysis (Figure S3) performed were explained in detail in supplementary results.
Among the 48,000 transcripts analyzed 3062 transcripts were differentially expressed (>1 fold in either of the direction, p value<0.05) (see Supplementary Data File S2 for the complete list of differentially expressed genes, DEGs). Out of the total DEGs, 1450 transcripts were up-regulated and 1612 transcripts were down-regulated under PCOS conditions. Hierarchical clustering analysis was performed to cluster transcripts based on their expression levels between samples. The mRNAs’ expression difference between PCOS and controls is shown in Fig. 4A.
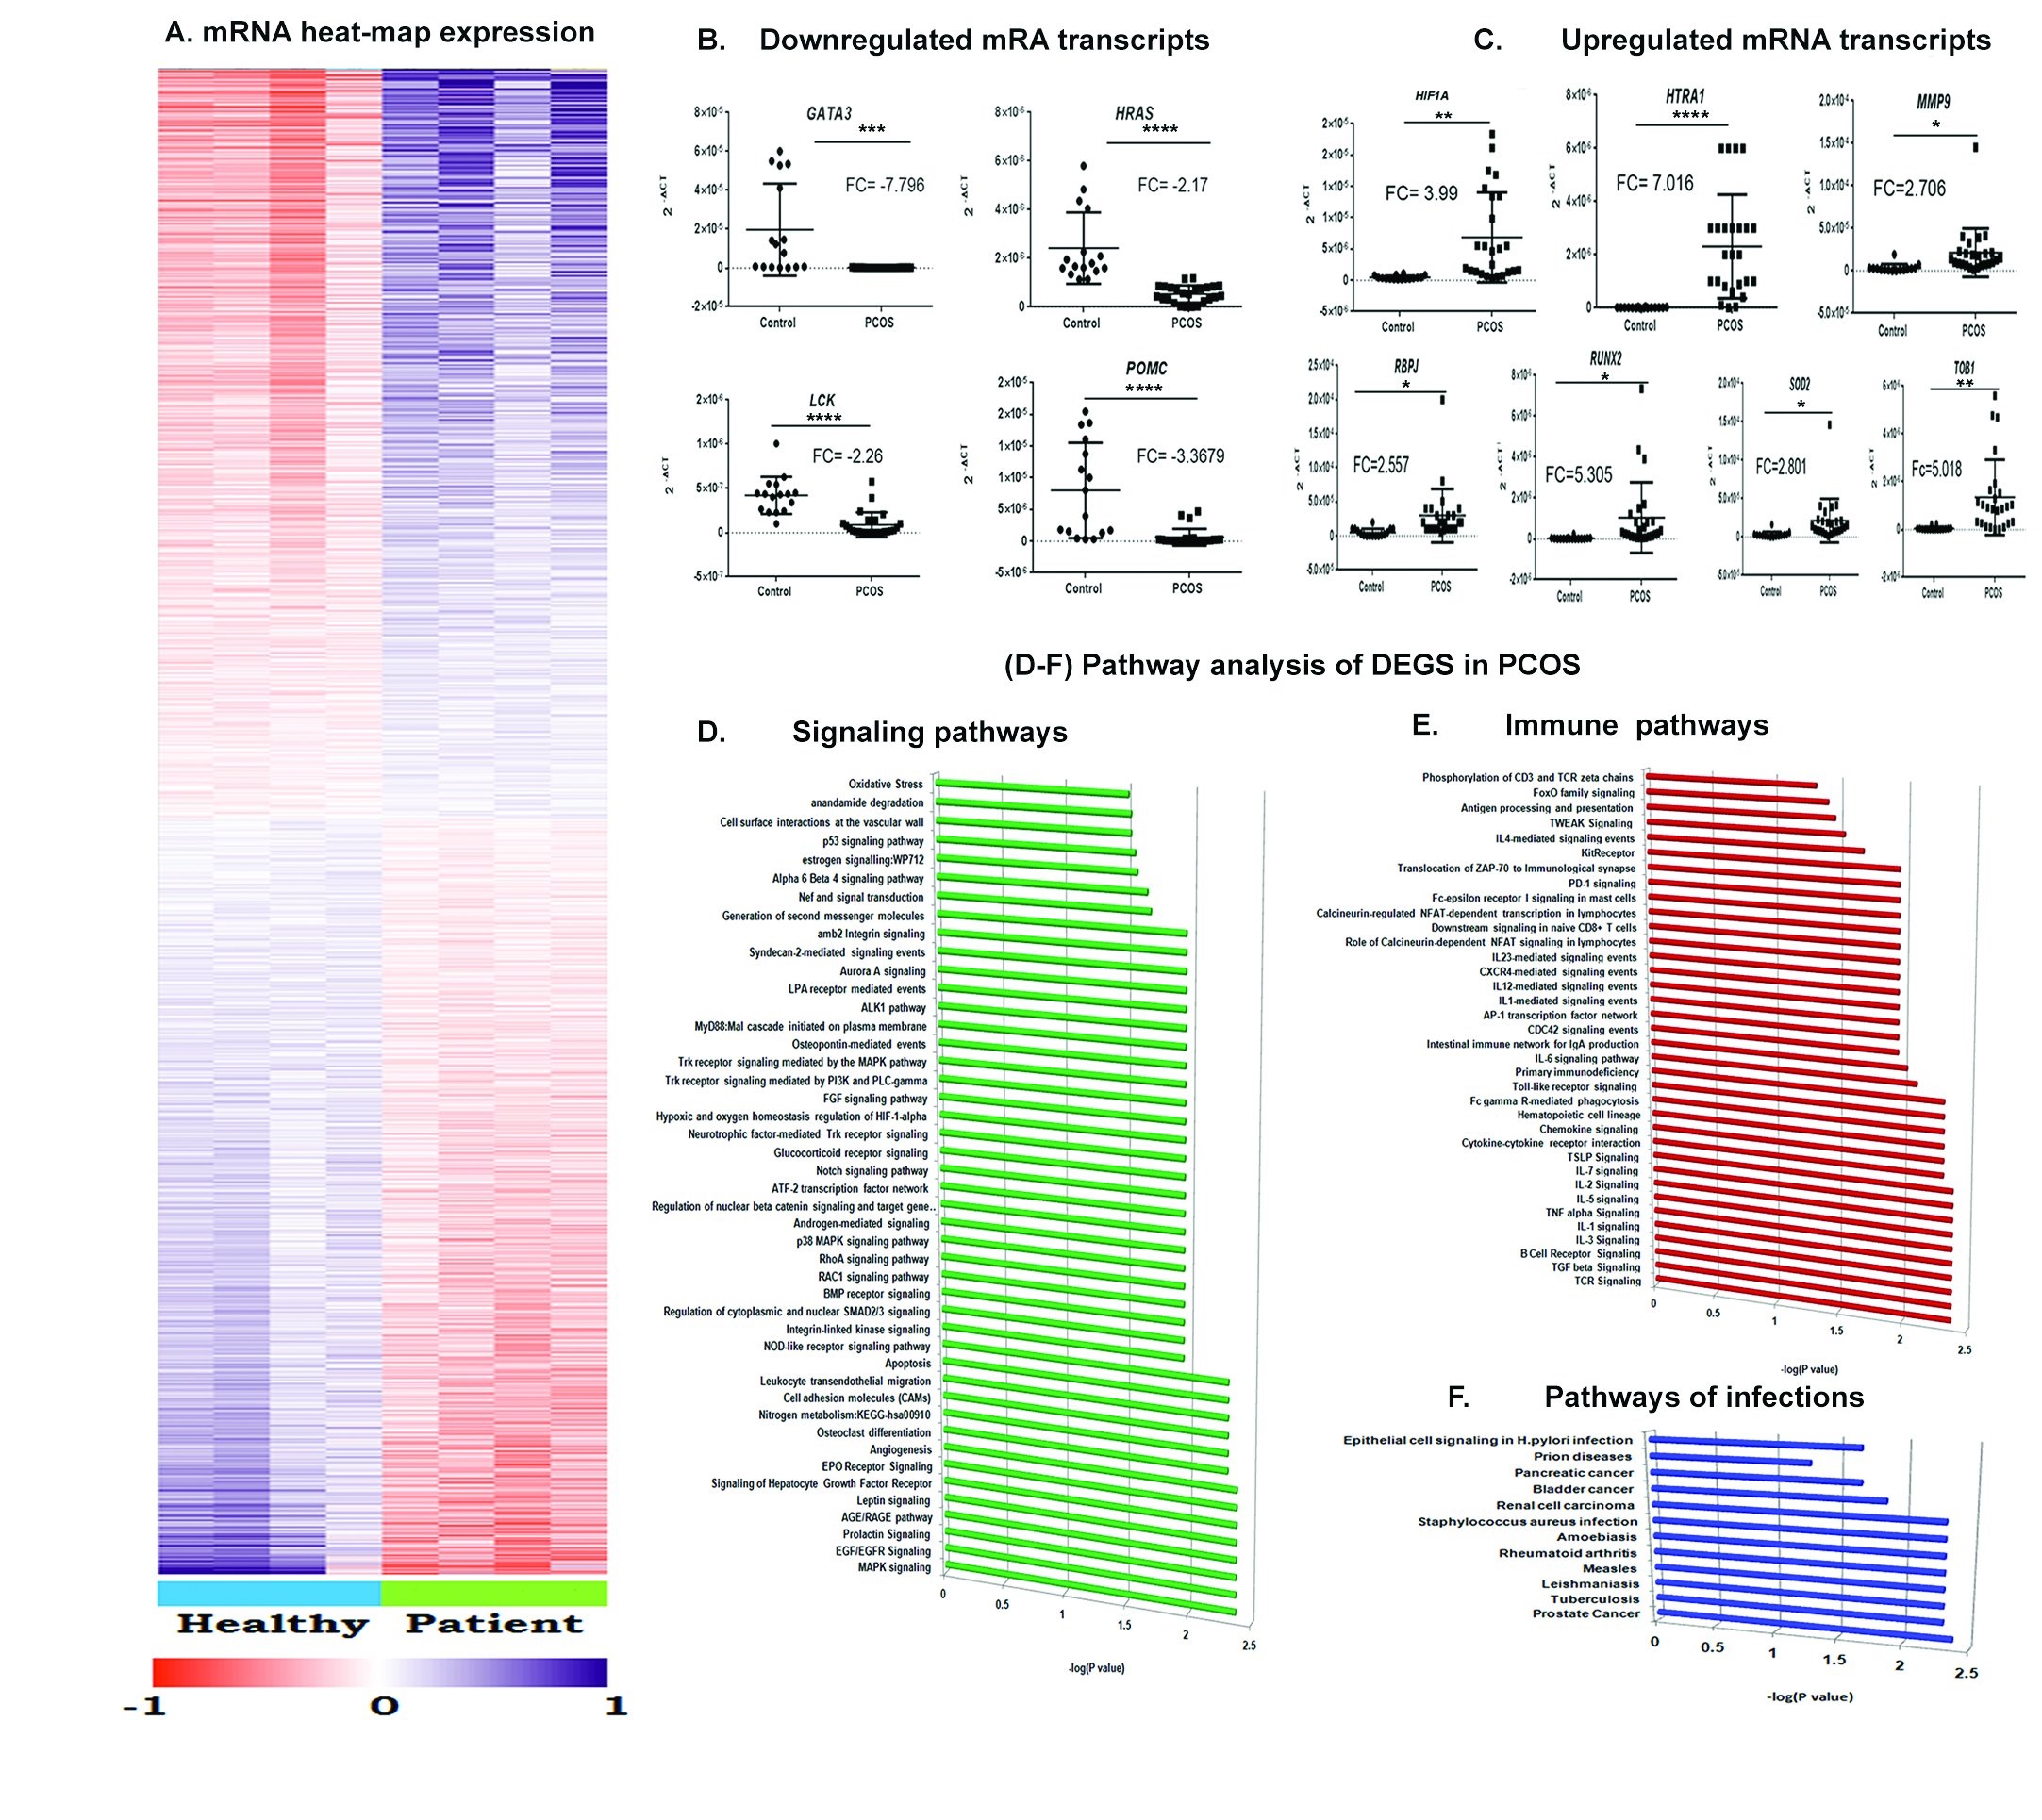
Fig. 4: PCOS specific peripheral differential gene profile. A) Heat map representation of the differential transcripts in peripheral blood of PCOS patients (n=4, Patients) and control subjects (n=4, Healthy). The columns represent the source of the samples either PCOS or control and the rows represent the differentially expressed mRNAs. mRNAs were grouped by unsupervised two way hierarchical clustering. Pink and blue colours indicate up and down regulation respectively relative to the overall mean for each mRNA. Relatedness in mRNA expression across the samples is shown by the hierarchical tree on the Y axis through standard linkage. B-C) Dot plot representation of the relative expression of selected DEGs across the samples. The 2-∆Ct values are plotted in Y axis of dot plots. The RQ (2-∆∆Ct) was calculated according to ∆∆Ct method using 18SrRNA as the endogenous control. Fold Change (FC) is represented as log2RQ. A single real time experiment was performed for each subject and transcript with the transcripts runs in triplicates. Statistical analysis was done using Graphpad Prism 6.0. D-F)Pathway analysis of the differentially expressed genes (DEGs) in peripheral blood of PCOS patients. The pathways are selected on the basis of adjusted P value and sorted by the number of differential transcripts. The horizontal axis represents the number of differential targets in each pathways. The pathways are grouped on the basis of the functions in which they are involved as D) Signaling pathways, E) Immune pathways and F) Pathways in pathogenic infections. (*p-value ≤ 0.05 and **p-value ≤ 0.01).
b. Validation phase
The selected DEGs were validated through qRT-PCR (Fig. 4).The data showed downregulation of GATA3, HRAS, LCK and POMC (Fig. 4B) and upregulation of HTRA1, MMP9, RBPJ, RUNX2, SOD2, and TOB1 (Fig. 4C) in the PCOS group. The results were consistent with those obtained by microarray analysis.
c. Analysis phase
Pathway analysis identified 142 pathways mainly involved in signal transduction including MAPK signaling, oxidative stress, and several pathways involved in immune signaling (Fig. 4D-F). The complete list of differential pathways is provided in Supplementary Data File S2.
Construction of PCOS specific Integrative Regulatory Network
Integrated Differential miRNA-mRNA Analysis in PCOS. The targets of the differential miRNAs (fold change >1) were predicted through miRWalk algorithm. miRWalk combines the predictions generated by 8 established algorithms i.e., RNA22, miRanda, miRDB, TargetScan, RNAhybrid, PITA, PICTAR and Diana-microT. To increase the reliability and stringency of the data, the filter was applied to select the targets with more than 5 database hits. The putative targets retrieved from the algorithm were compared with our differential transcripts (fold change >1, P-value <0.05). In the down-regulated miRNAs hsa-miR-202 targeted a maximum of 34 up-regulated transcripts. Up-regulated hsa-miR-133a targeted the maximum of 60 down-regulated transcripts. Considering only those transcripts showing opposite types of regulation (down transcripts for up miRNAs and up transcripts for down miRNAs) a pie diagram was generated to show the number of differential downregulated targets for upregulated miRNA’s (Fig. 5 A, See Supplementary Data File S3) and differential upregulated targets for downregulated miRNA’s (Fig. 5 B; See Supplementary Data File S4).
We generated a functional network combining the differential miRNA-mRNA pairs using Cytoscape Plugin (Fig. 5C; See Supplementary Data File S5). 1129 interaction pairs were present in the network. Hsa-miR-411 was involved in maximal and hsa-miR-331-5p in a minimal number of functional interactions. Laminin α5 (LAM α5) was targeted by 8 differential miRNAs (hsa-miR-192, hsa-miR-193a-3p, hsa-miR-193b, hsa-miR-210, hsa-miR-28-5p, hsa-miR-31, hsa-miR-451 and hsa-miR-411 ) and PLAUR , GLG10 and MMP9 were the other majorly targeted transcripts(Fig. 5C; See Supplementary Data File S5). The broad categories of pathways associated with the network obtained by collating several specific pathways includes adipogenesis, angiogenesis, cell cycle regulation, cytoskeletal reorganization, enzyme regulation, immune system process, metabolism, signaling, transcriptional regulation and transport. 76 of the miRNA-mRNA pairs were involved in all these functional interactions. The pathways are merged on to the functional network and represented by lines. The sub networks of negative regulation (miRNA under-expressed and targets over expressed; See Supplementary Data File S4) is shown in Fig. 6A and positive regulation (miRNA over expressed and its targets under-expressed; See Supplementary Data File S3) is shown in Fig. 6B.
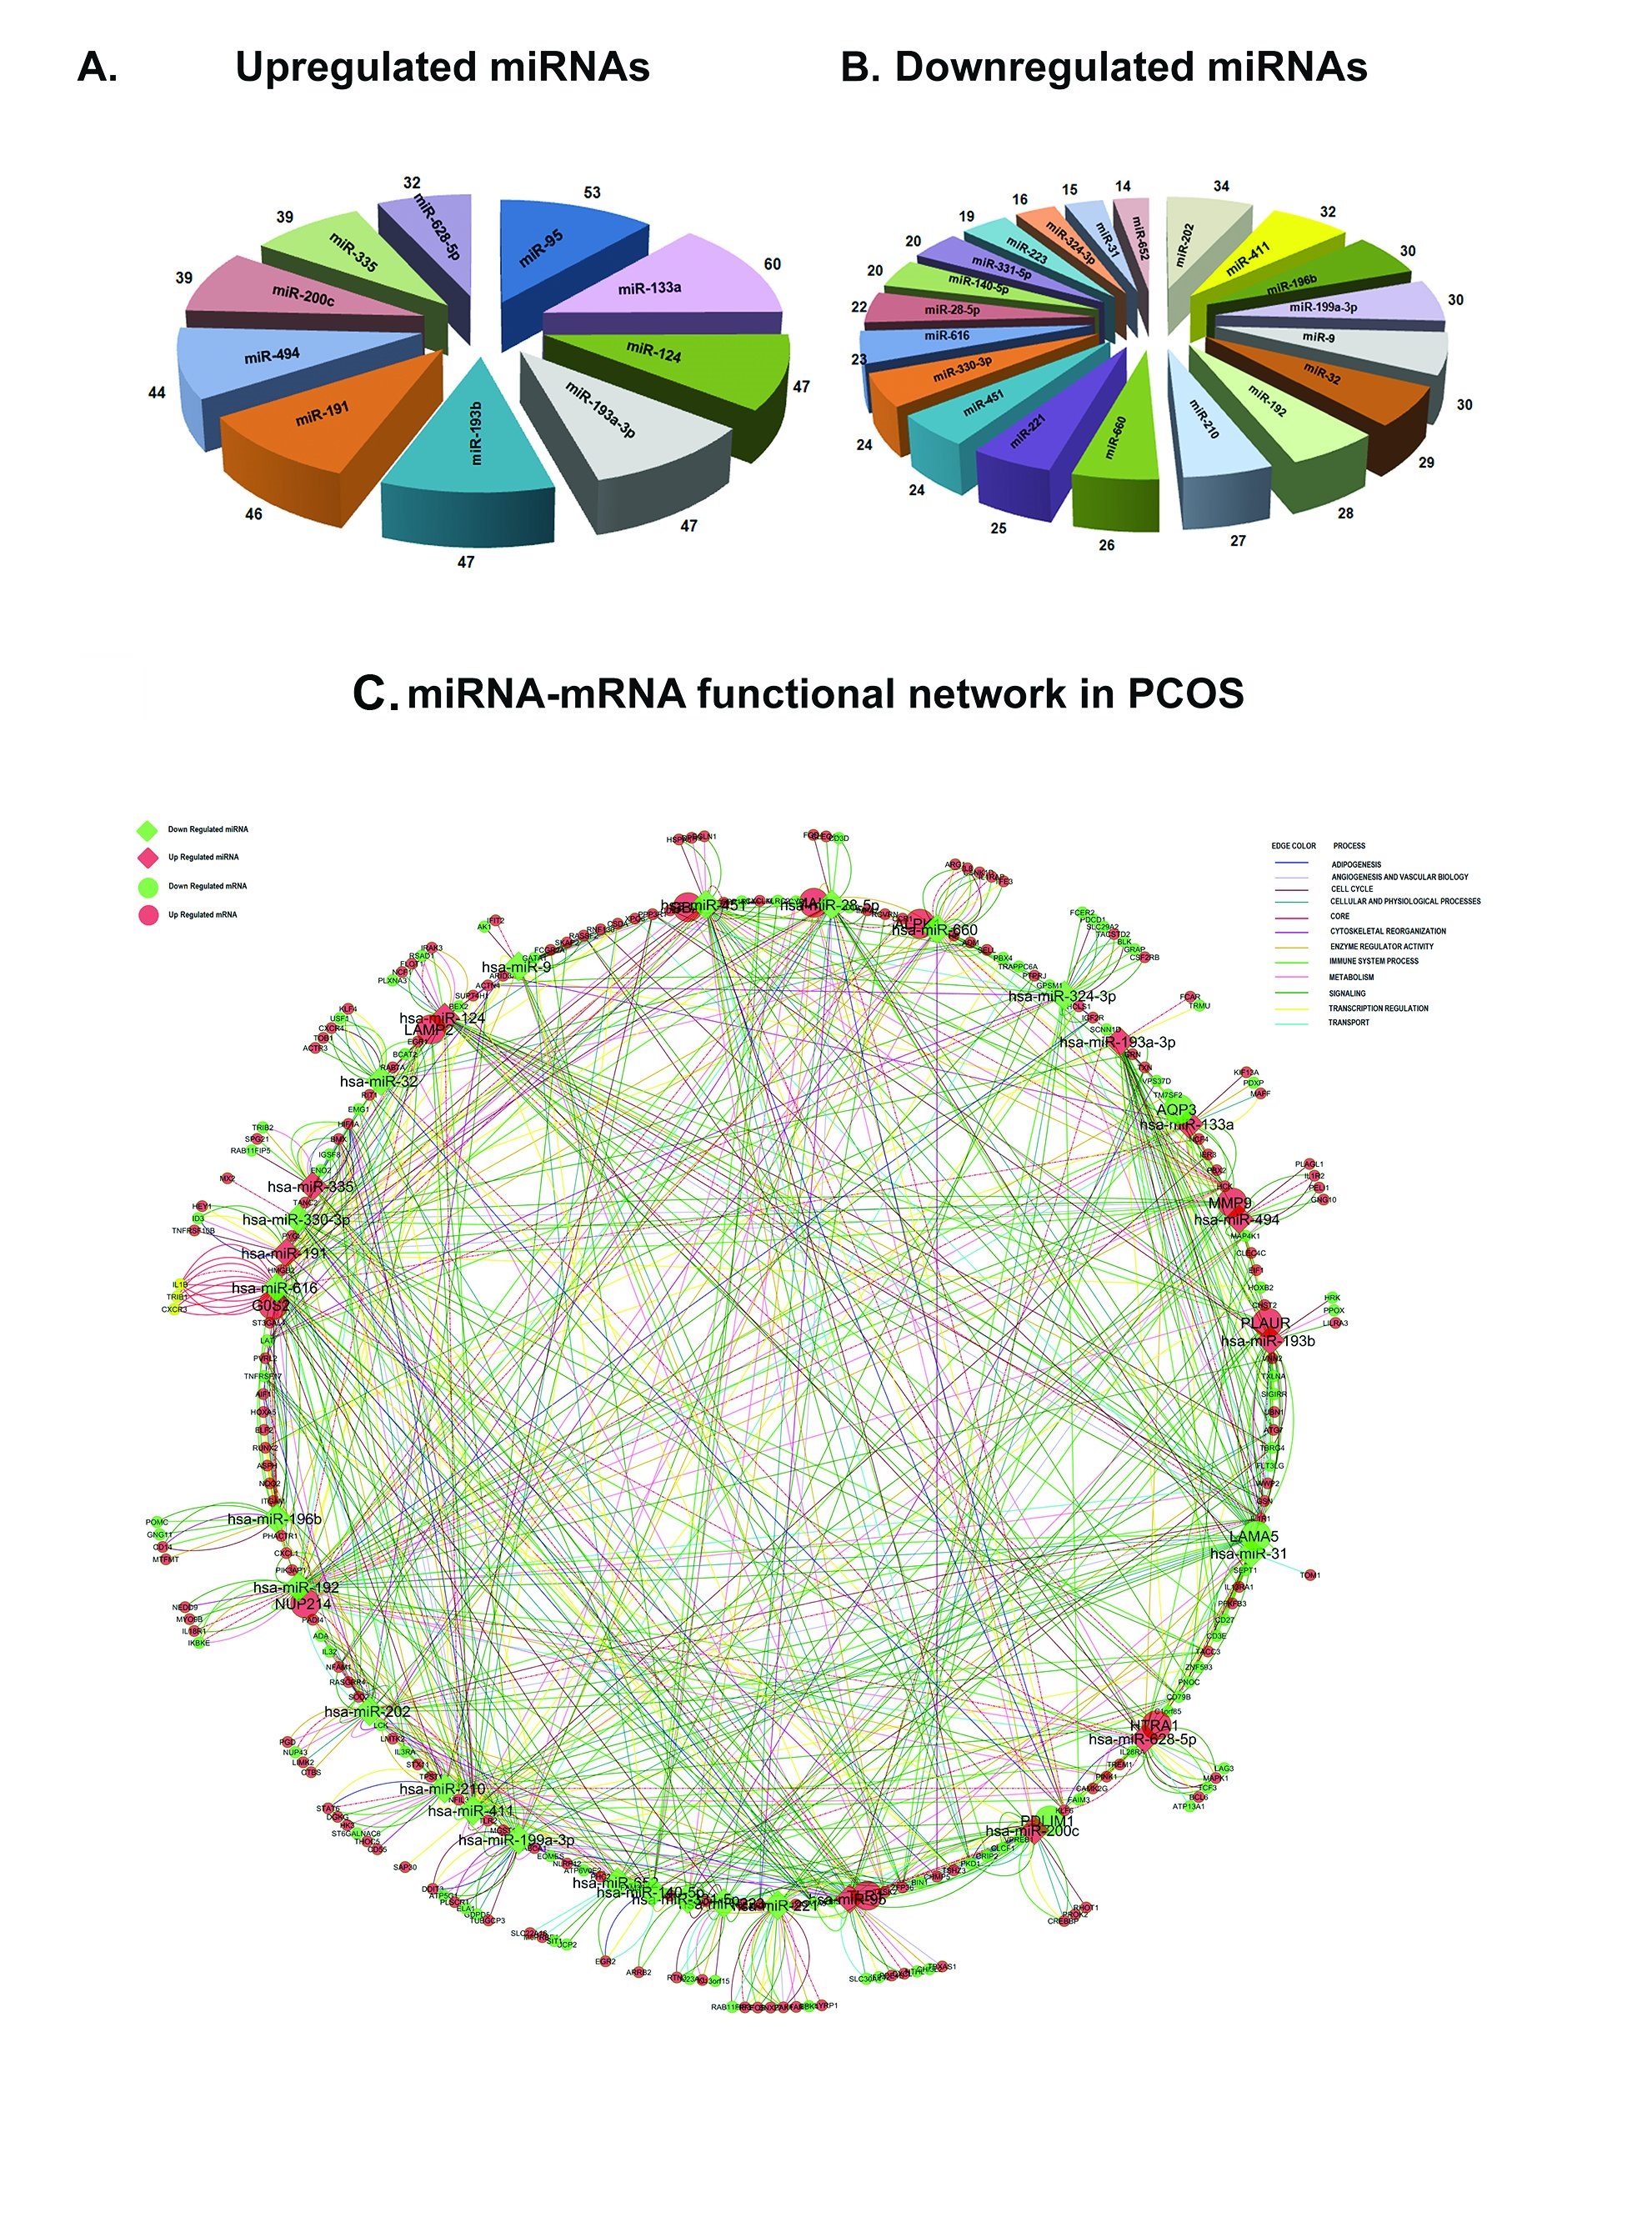
Fig. 5: A-B. Target enrichment of differential miRNAs.The targets were predicted using miRWalk algorithm. The number of differential targets are denoted at the chart’s end. C. miRNA-mRNA functional network in PCOS. The network comprises all the possible interactions between the miRNA-miRNA pairs. miRNAs are represented in diamond shape and transcripts in circles. Red means up regulation and green means down regulation. The size of each node depends on the number of interactions. The functional interactions in different categories are denoted as different color lines.
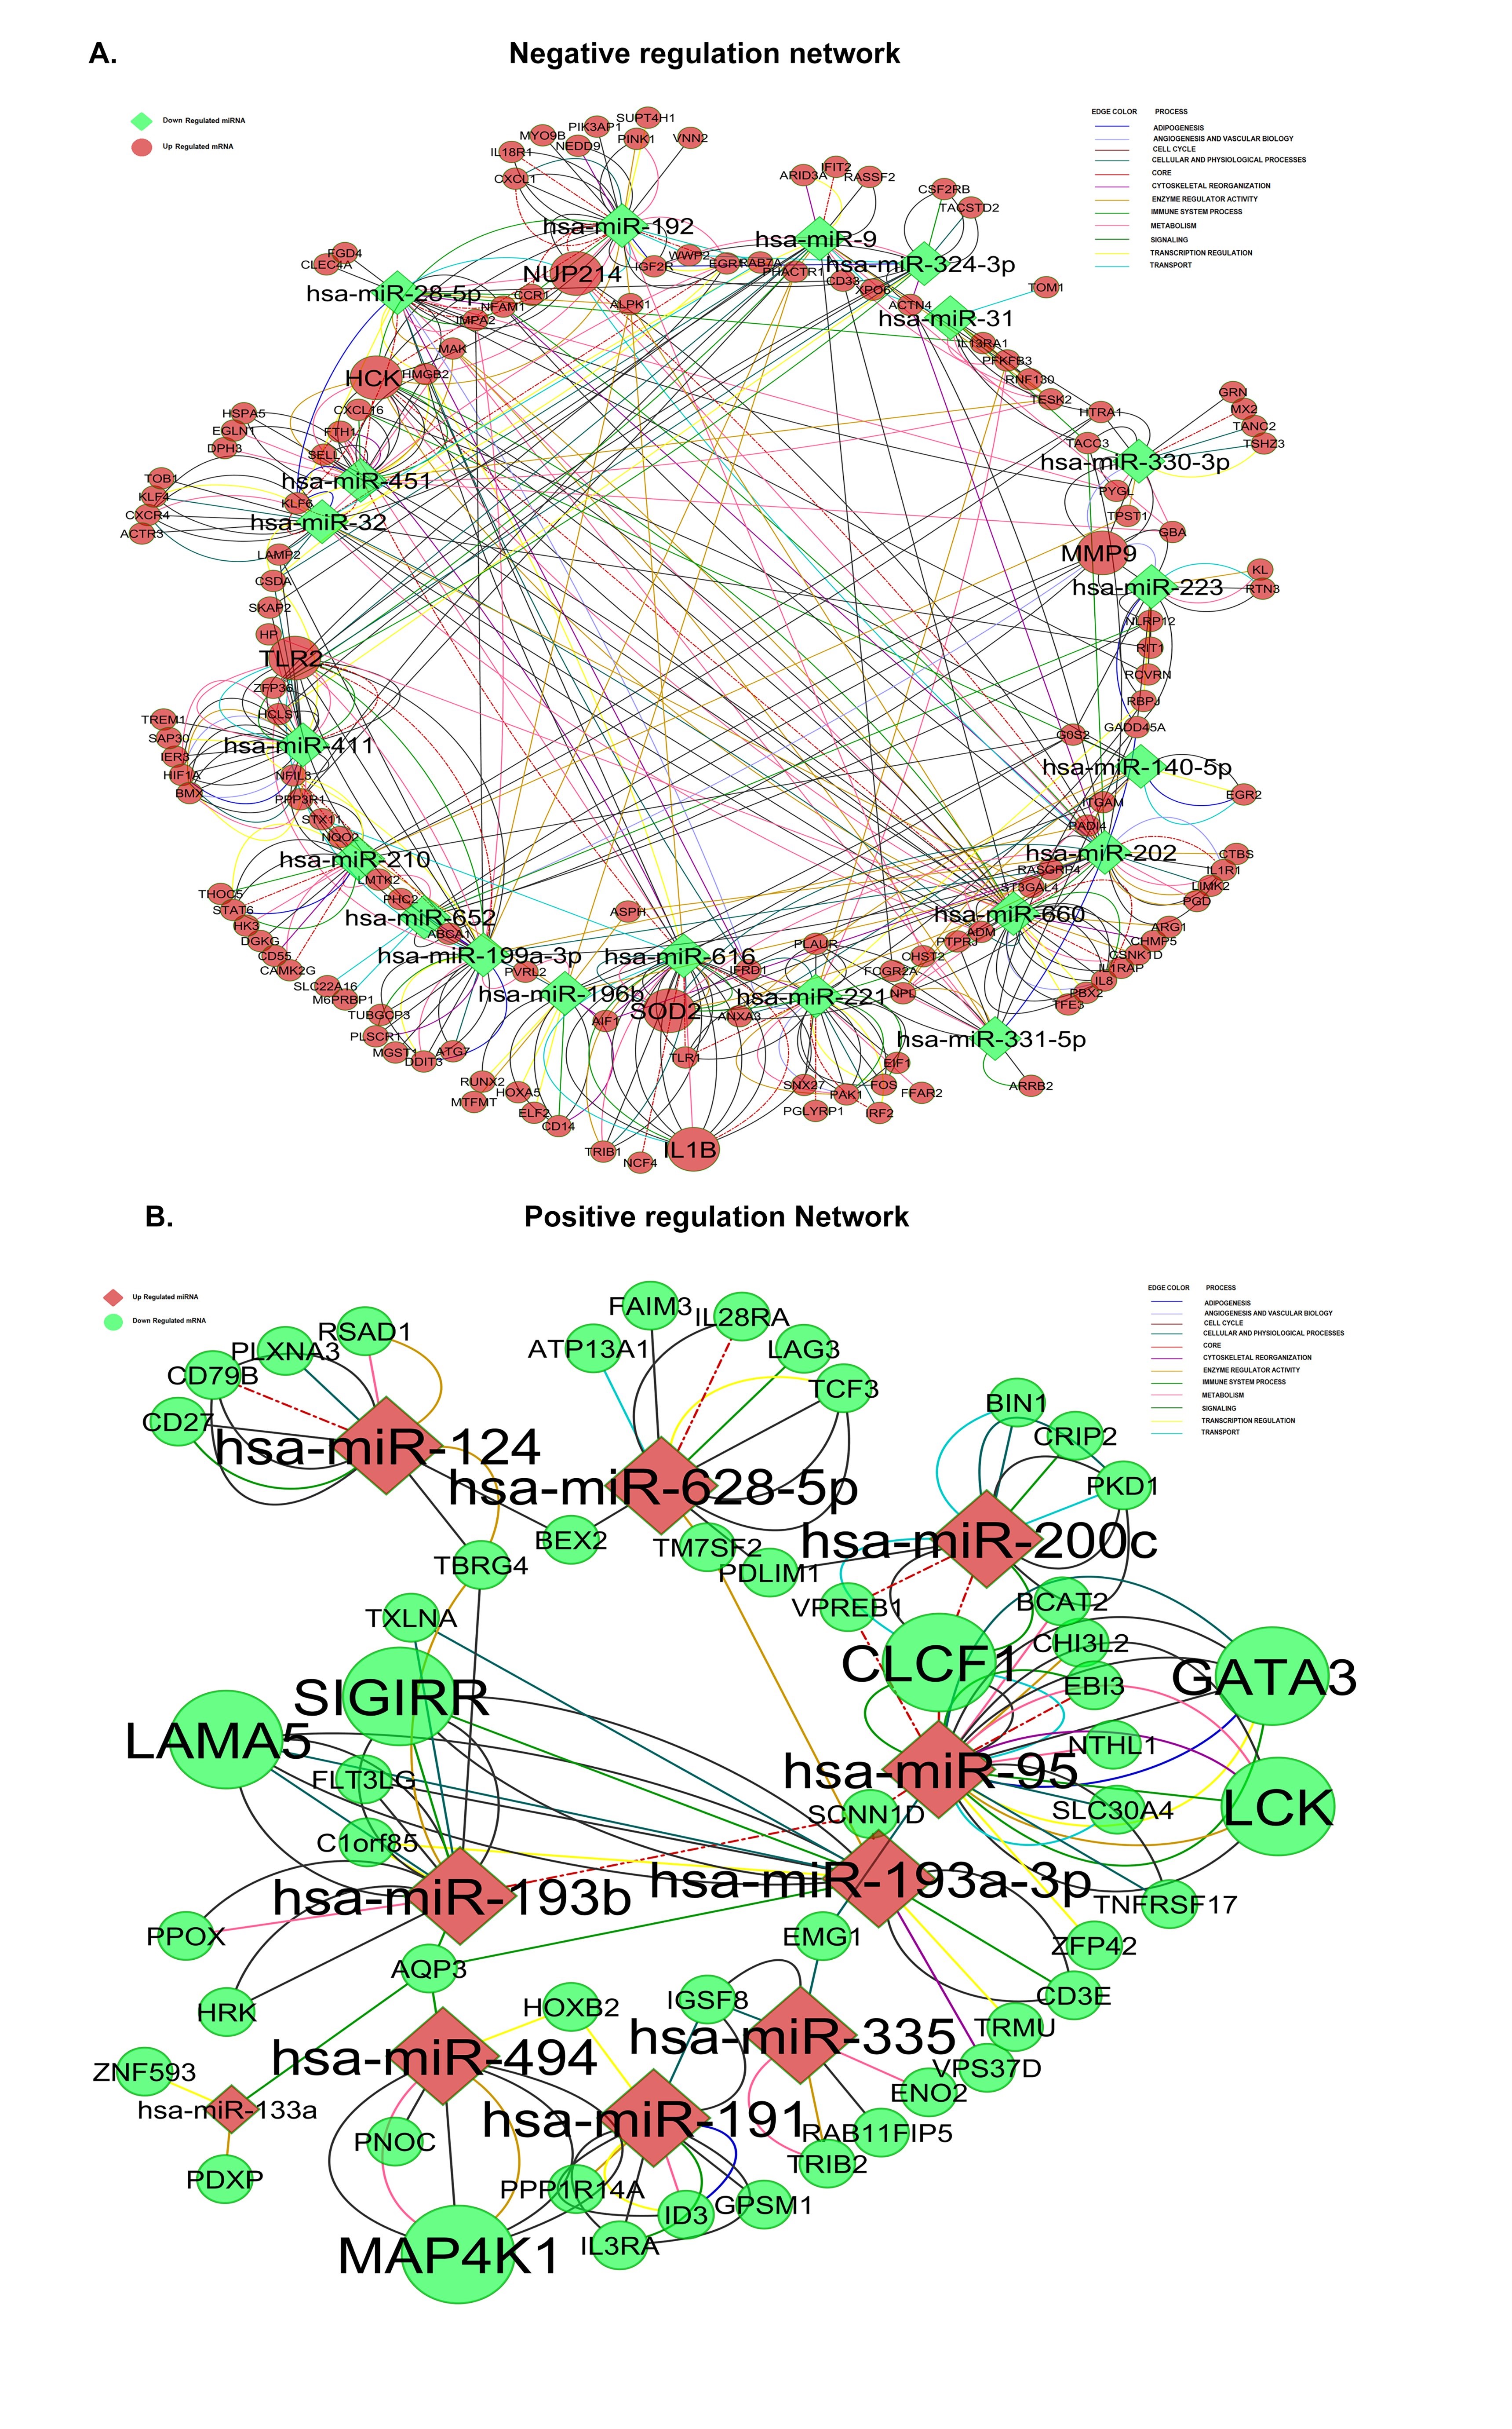
Fig. 6: miRNA-mRNA functional network in PCOS. A) Negative interaction network comprises of down regulated miRNAs and up regulated transcripts. B) Postive interaction network comprises of up regulated miRNAs and down regulated transcripts. miRNAs are represented in diamond shape and transcripts in circles. Red means up regulation and green means down regulation. The size of each node depends on the number of interactions. The functional interactions in different categories aredenoted as different color lines.
The Regulatory FFL and its functional role in PCOS
To generate the integrative network we constructed a FFL involving the interaction among miRNAs, mRNA and known human TFs. We identified the targets of the miRNAs using miRWalk public database (http://www.ma.uniheidelberg.de/apps/zmf/mirwalk). To improve the dependability of our approach, experimentally validated miRNA- targets from miRWalk were extracted for the analysis and miRNA- gene loops were created by merging the data with our differential data. The list of 115 Human TFs and 5030 known human miRNA/TF singular circuits were extracted from a user-friendly web server CircuitsDB (http://biocluster.di.unito.it/circuits). By combining PCOS miRNA and mRNA differential expression profiles and the transcription factor binding profiles we analyzed the different types of regulations: TF regulating gene (TF-gene) or miRNA (TF-miRNA), miRNA inhibiting of a gene (miRNA-gene) or TF (miRNA-TF). In our network miRNA or TF served as ‘Node1’ and mRNA or TF or gene served as ‘Node2’. This generated a complex cluster with lots of possible interactions (Fig. 7A).
In order to obtain a better resolution of the network in Fig. 7A, we applied stringent statistical parameters of the miRNA -mRNA pairs based on the minimal free energy (MFE) to create an evidence-based 3-node TF-miRNA- mRNA network. We also confirmed that each component is involved in multiple regulations. Based on the critical biological pathways we then dissected the network into sub-clusters. This approach enabled us to get deep insights into the key regulators in each cluster representing specific pathways. The validated targets of the 30 differential miRNAs extracted from miRWalk database and the identified 1262 genes from our microarray data were the possible targets of these miRNAs. 112 human TFs in the list were found targeting 1213 genes and 11 miRNAs. We generated a resolved FFL network with all these parameters which is depicted in Fig. 7B.
We also performed an enrichment analysis to identify the target genes regulated at transcriptional and post-transcriptional levels by multiple TFs and miRNAs and selected nodes (miRNA and /or TF) with more than 10% enrichment. In this network, we applied statistical stringency (p-value <0.05) for differentially expressed mRNA to get significant pairs. Accordingly, we obtained the key network (Fig. 8; See Supplementary Data File S6) consisting of 17 TFs, 6 miRNAs and 25 mRNAs interacting in 100 different ways. The key network consisted of 16 non-orphan network clusters with 50 TF-gene pairs, 8 TF-TF pairs 6 miRNA-TF pairs and 36 miRNA- gene pairs. Among the 6 miRNAs, hsa-miR-9 was found to be involved in the maximum number of interactions viz., ATF6, BCL6, CCND2, IL1β, JUN, MMP9, STAT3, STAT6. The gene-annotation enrichment analysis recognized the enriched Gene Ontology (GO) terms relatedto the PCOS specific FFL and the functionally related groups were categorised basis of enrichment analysis. The specific enriched clusters consisted of broad ontology terms viz., peptide hormone signaling, steroid hormone signaling, response to vitamins and nutrition, oxidative stress, wnt pathway, EGF signaling, PDGF signaling,TPO signaling, MAPK cluster, JAK-STAT signaling, IL signaling and T/B cell activation, response to bacteriae, angiogenesis, apoptosis and cell cycle regulation, female pregnancy and regulation of transcription. The significant subcategories showing % enrichment as well as key node interactions, GO and key pathways are listed in Supplementary Data File S6. The details of the integrated network were dissected using Cytoscape Plugin into 16 sub-clusters as shown in Fig. 9.
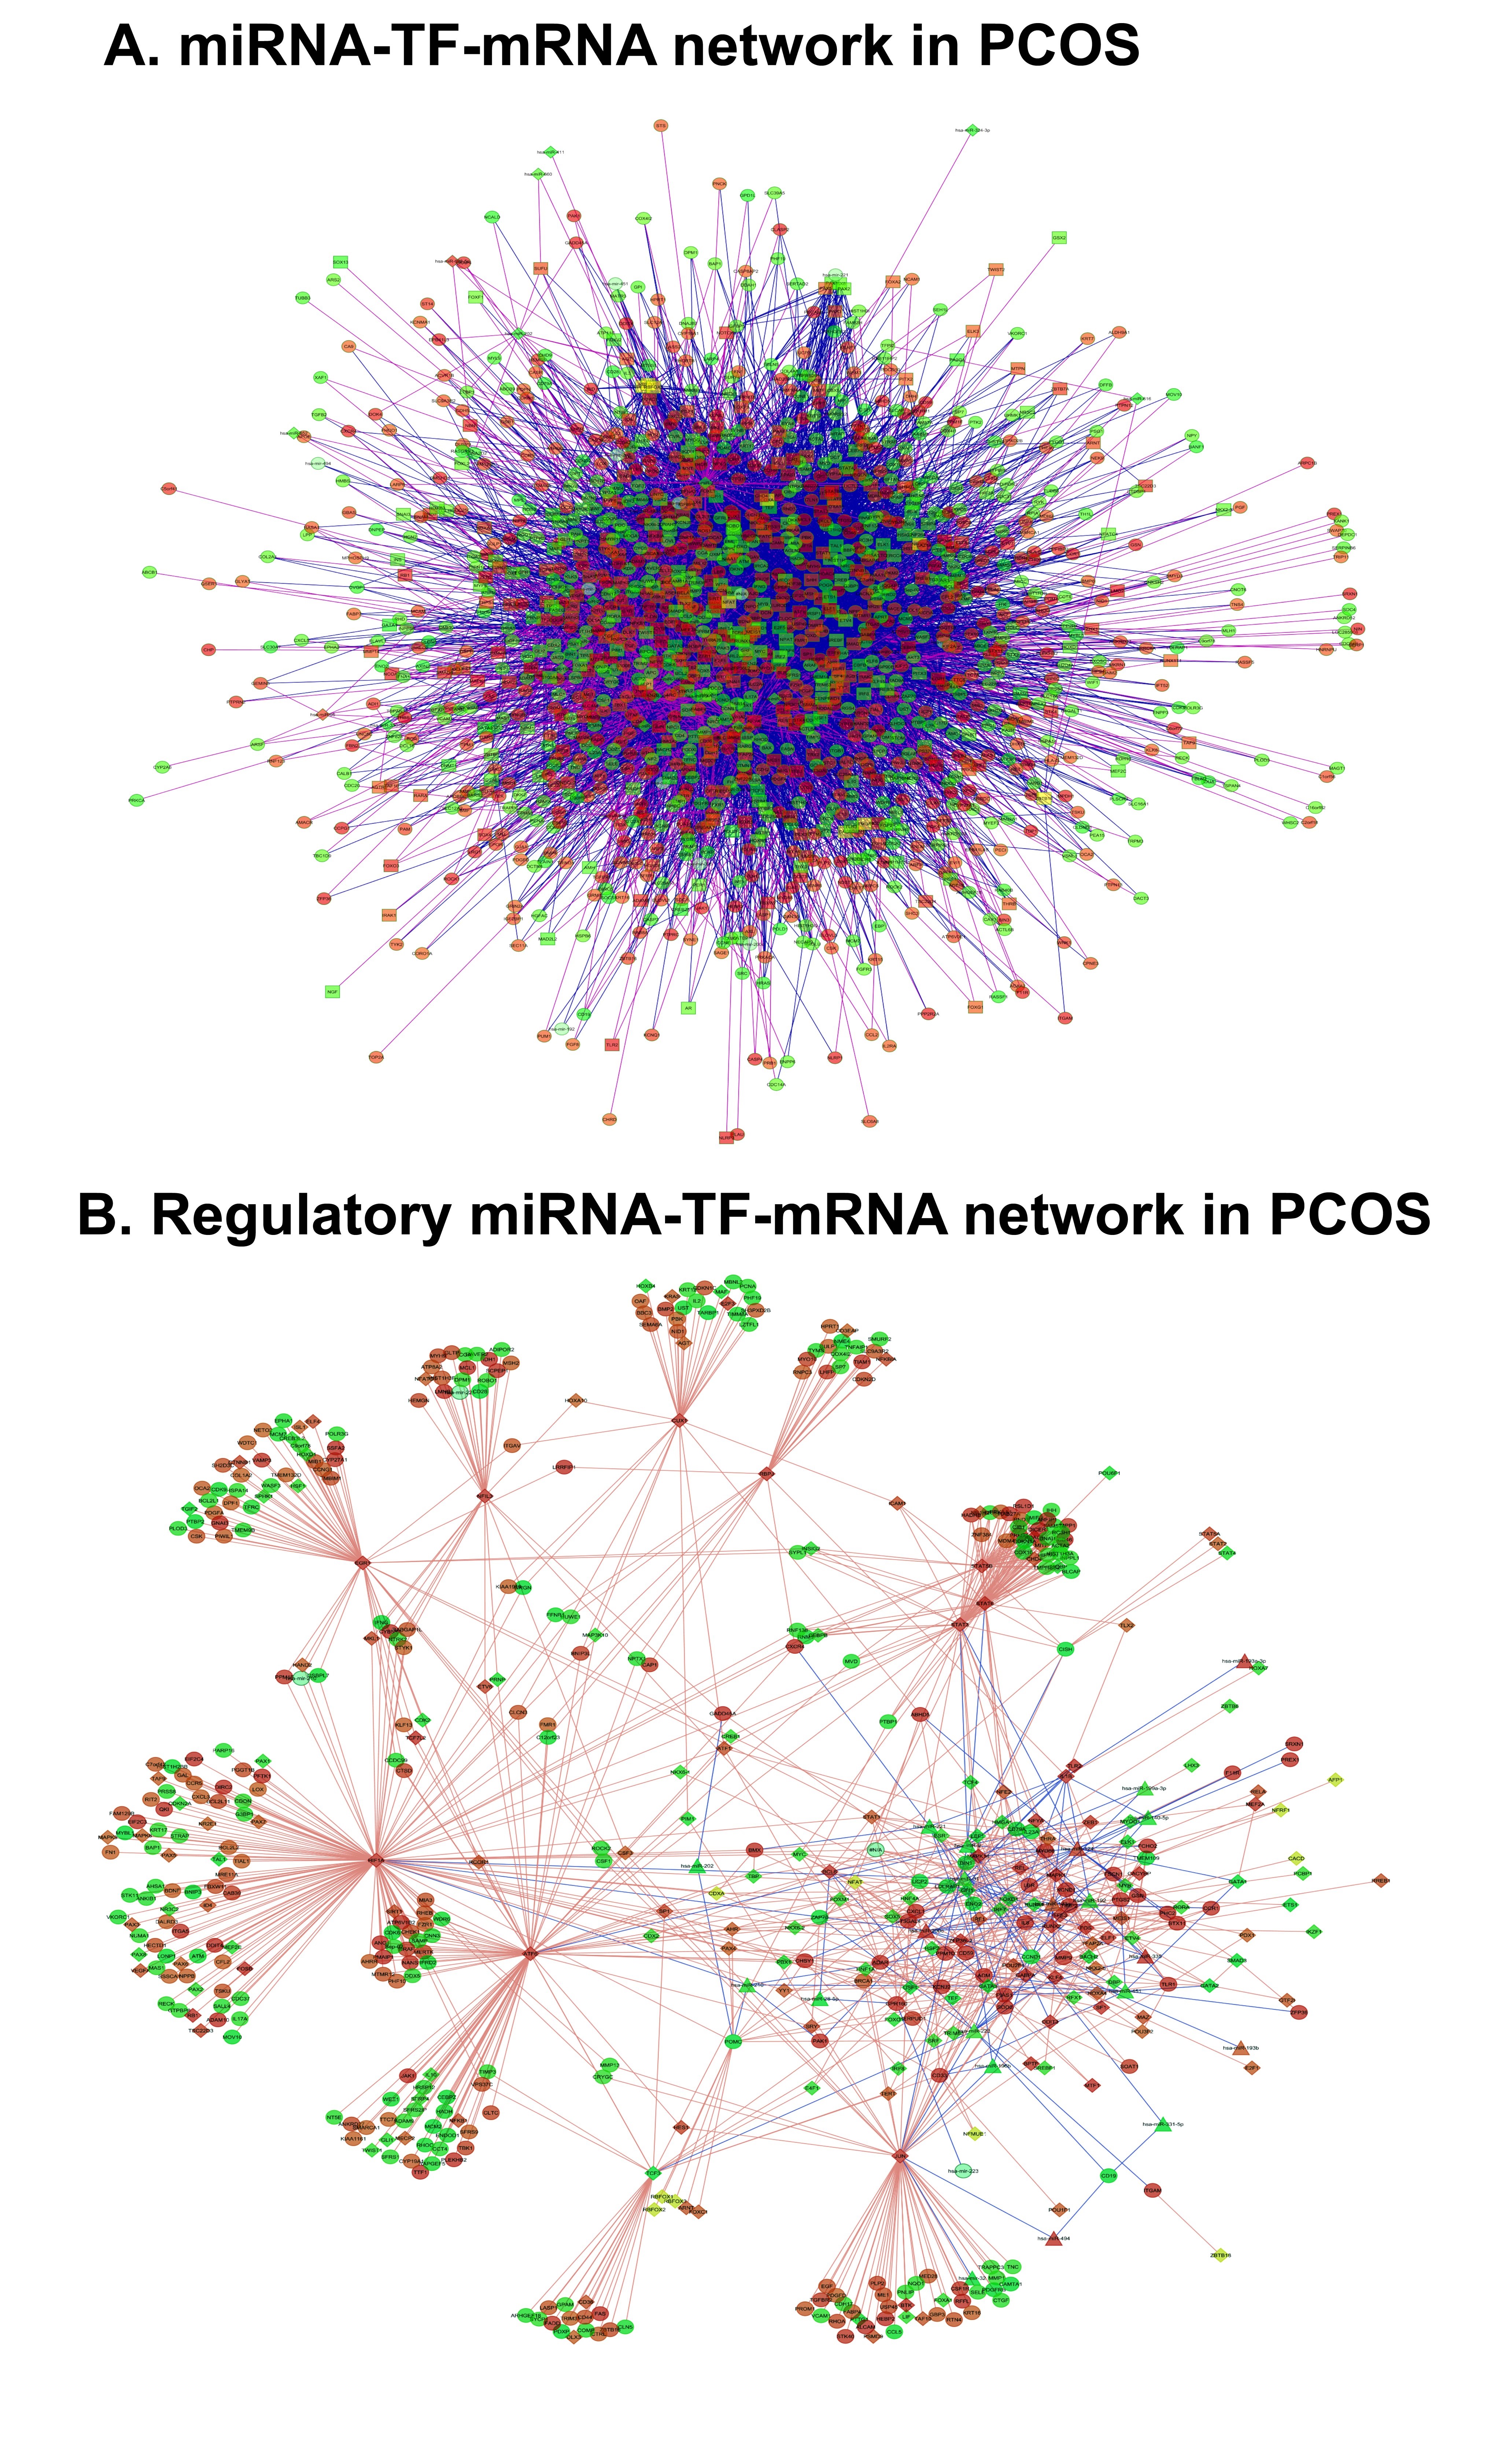
Fig. 7: The miRNA-TF –mRNA network specific to PCOS peripheral blood. A) The initial network comprising all the possible interaction among the miRNAs, mRNAs and TFs. B) The regulatory network generated by applying significant miRNA-mRNA, miRNA-TF and TF-mRNA binding pairs on the basis of minimal free energy (MEF) into the initial network. The mRNAs are represented as circles, TFs as rectangles and miRNA as triangles. Red and green indicate up and down regulation respectively.
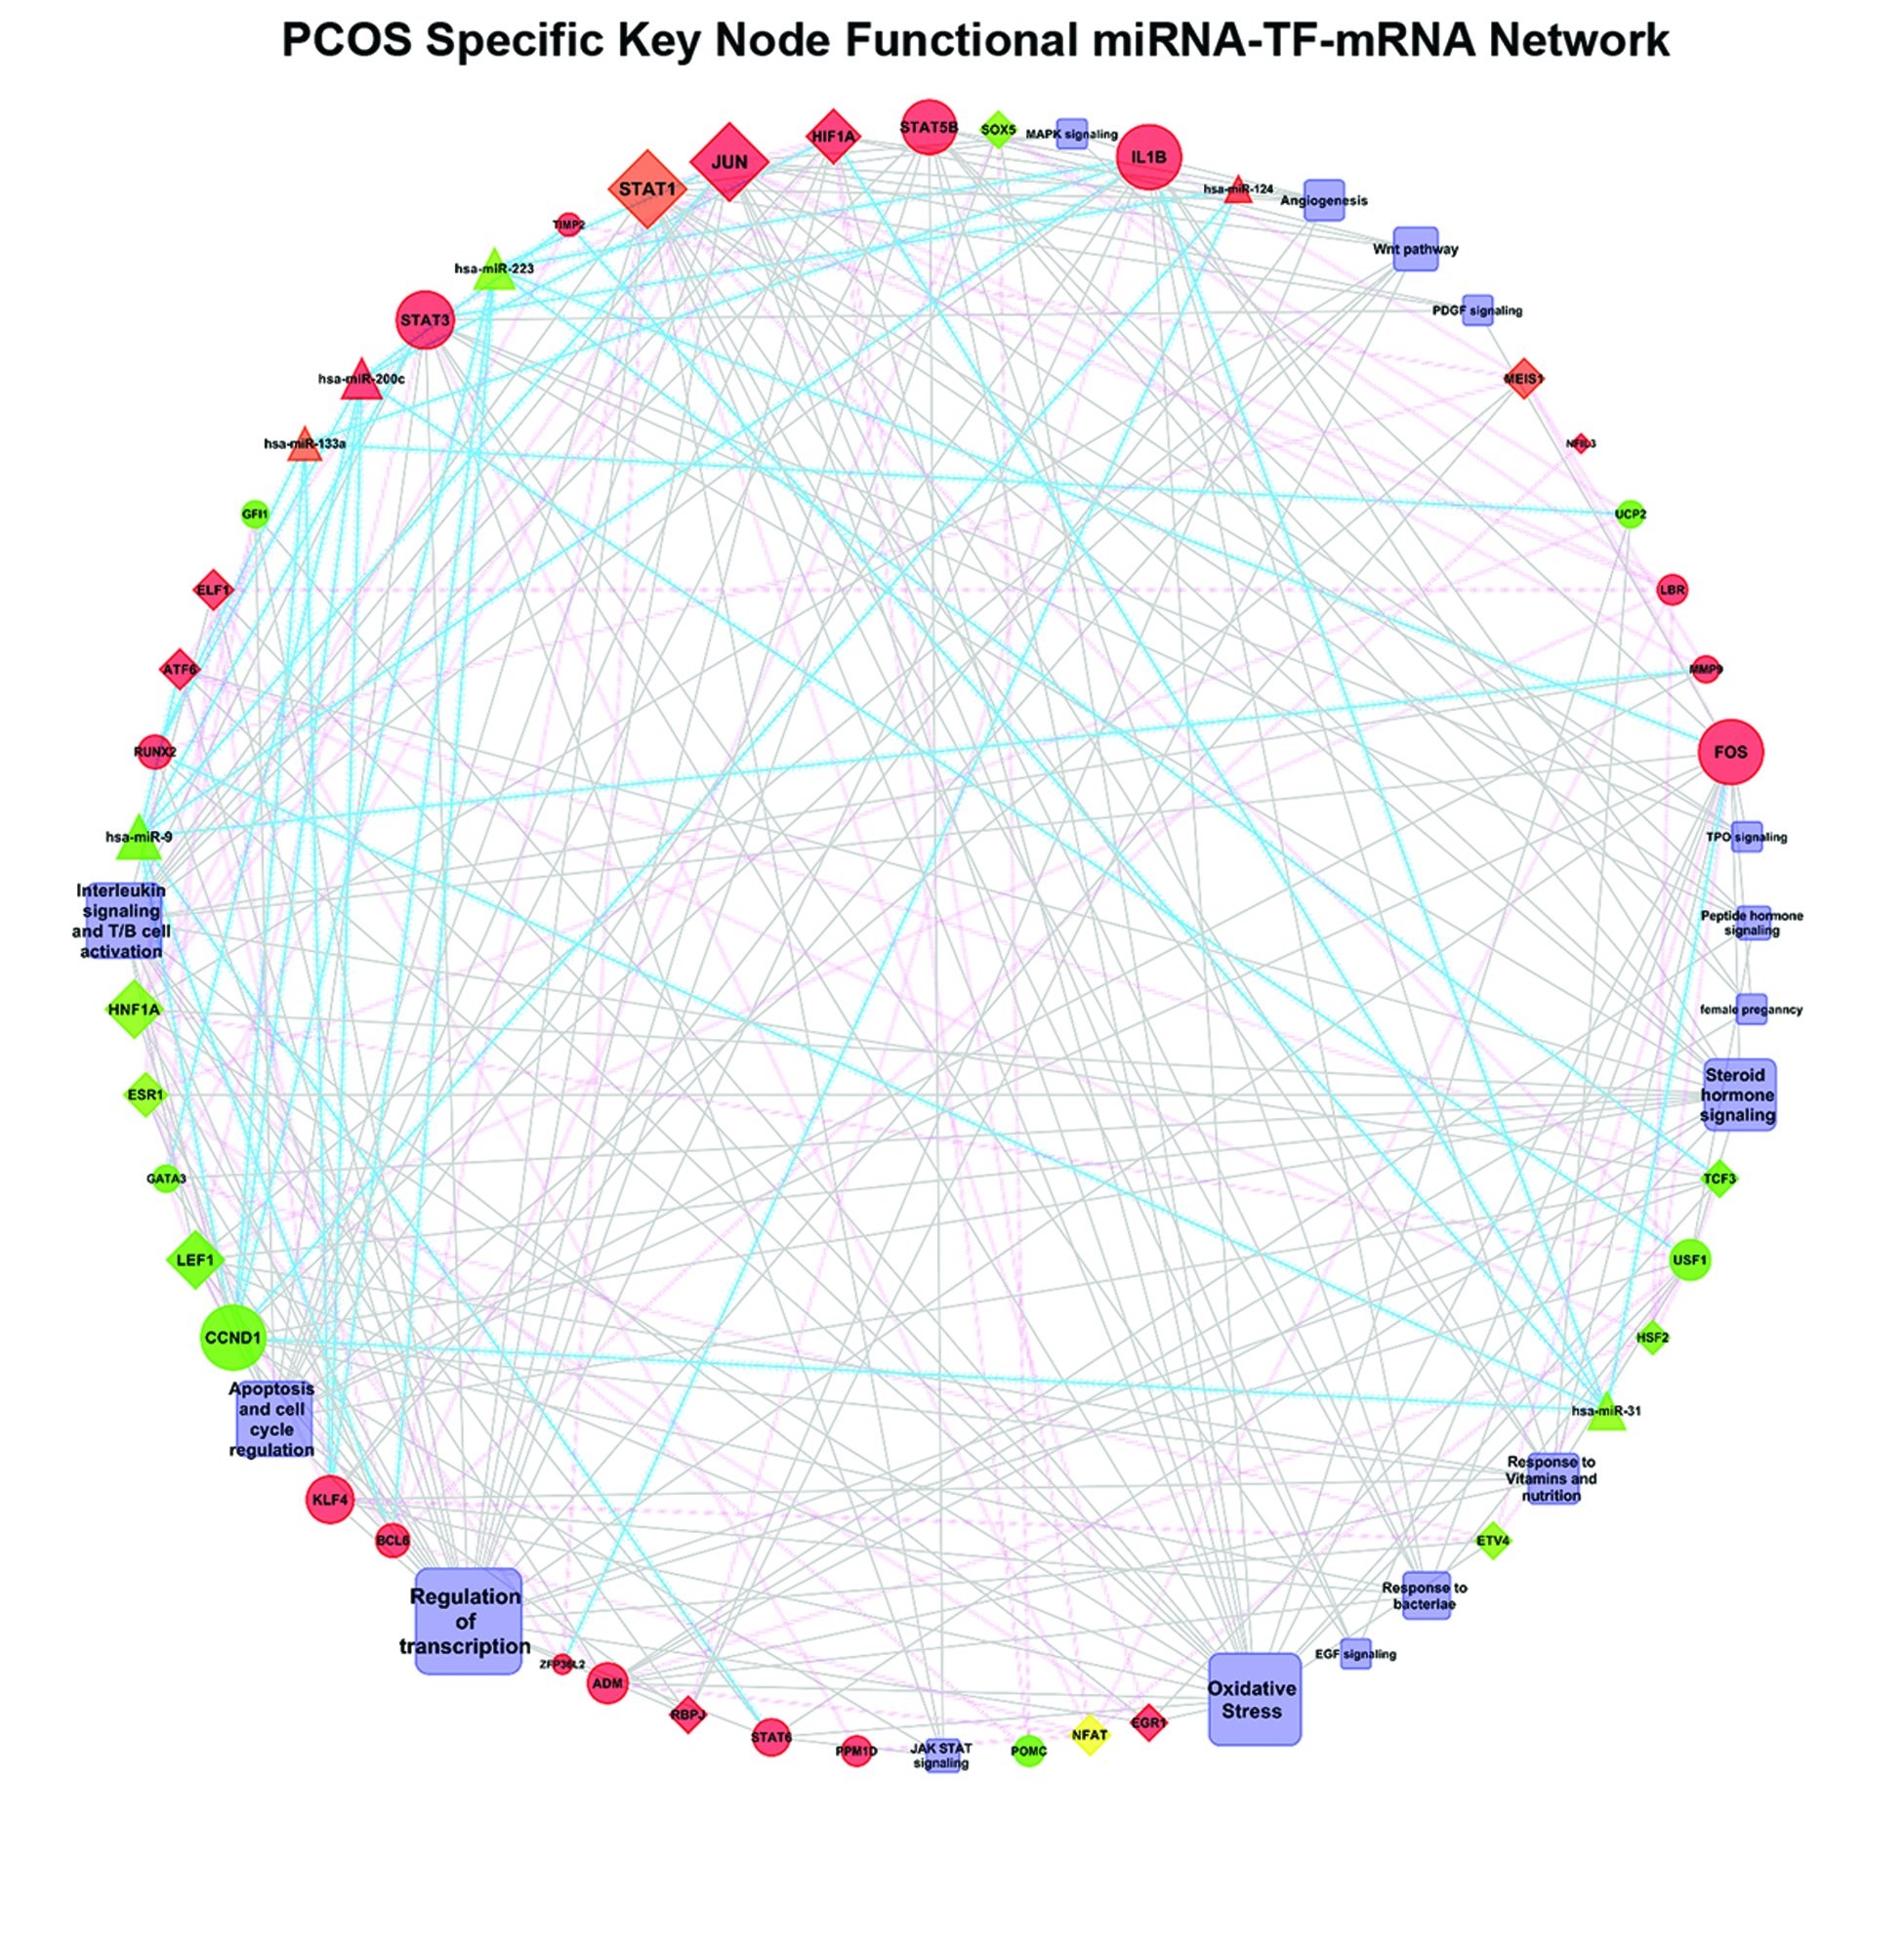
Fig. 8: The key node functional miRNA-TF- mRNA network specific to PCOS peripheral blood. The network comprises the significant interacting pairs among significant DEGs (fold change>1, P value<0.05), differential miRNAs (fold change>1) and TFs on the basis of minimal free energy (MEF). The mRNAs are represented as circles, TFs as rectangles and miRNA as triangles. Red and green indicate up and down regulation respectively. Blue and pink line indicate post transcriptional (mediated by miRNAs) and transcriptional (mediated by TFs).
Overactivated stress-activated kinases (SAPKs) upregulates c-JUN/STAT3 IN PCOS Women
Our transcriptome profiling revealed the Mitogen-Activated Protein kinase (MAPK) pathway to be upregulated in PCOS women as evidenced by significantly enriched pathways viz., MAPK signals (DEGs -21), p38 –MAPK signaling (DEGs- 24), EGF receptor (ErbB1) signaling pathway (DEGs- 115) and PDGF signaling (DEGs-115) (See Supplementary Table S1). Our integrative miRNA-mRNA network analysis with FFL as the key node also identified MAPK signaling as one of the 16 clusters. This is further substantiated by the differential expression of MAPK and its target genes as seen in our Microarray data and hence we assessed the MAPK pathway components further.
Our real-time PCR analysis further confirmed the upregulated MAPK pathway in PCOS women as observed by an increased expression of GRB2 (1.60 FC, p≤0.02),SOS1 (0.78 FC, p≤0.01), RAC2 (1.23FC p≤0.01), MAPK1/ERK2 (4.53FC, p ≤0.0002) , p38( 1.3 FC, p≤0.01), JNK ( 1.4 FC, p≤0.04), JUN (4.99FC, p ≤0.005), and STAT3 (2.00 FC, p ≤0.0001) (Fig. 10A) when compared to the control group. Interestingly a downregulation in MAPK3/ERK1 (1.01 FC, p≤0.03)(Fig. 10A) transcripts were observed in PCOS women than in control women. Our western blot analysis showed that the expression of adaptors involved in signal transduction for the MAPK pathway, viz., Son of Sevenless (SOS1) (P≤0.003) and growth factor receptor-bound protein 2 (GRB2) (P≤0.01) were significantly up-regulated in PCOS patients (Fig. 10B-C). We also found a decreased expression of both total ERK (ERK1/2) (P≤0.17) and pERK (P≤0.16) (Fig. 10B-C) in PBMCs of PCOS subjects when compared to controls. The conserved serine/threonine MAPKs - p38 MAPK (p38MAPK) and c-Jun N-terminal kinases (JNK) are collectively called stress-activated kinases (SAPKs). Assessment of these molecules by western blot revealed significantly increased expression of p38MAPK (P≤0.007), pJNK (P≤0.02) and Ras-related C3 botulinum toxin substrate 1 (RAC2) (P≤0.04) in PBMCs of PCOS women while the increase in phosphatidylinositol 3kinase, PI3K (P≤0.17) was insignificant (Fig. 10D-E). Furthermore, we also found an overexpression of downstream effectors of SAPKs; c-Jun (P≤0.05), signal transducer and activator of transcription (STAT3) (P≤0.008) and pSTAT3 (P≤0.04) in PCOS group (Fig. 10B-C). These results enable us to postulate the existence of an overactivated SAPK pathway in peripheral blood of PCOS patients.
Discussion
In the current study, we have attempted to identify the pathways affected in PCOS by creating a computational framework of 3-node FFL with distinct miRNA, mRNA and transcription factors based on the expression profile of miRNA and mRNA in peripheral blood of PCOS patients.
Our relative expression analysis of miRNAs identified 20 under-expressed miRNAs and 10 over-expressed ones in peripheral blood. Hsa-miR-133a, is shown to be upregulated while Hsa-miR-199a-3p was downregulated similar to the reported trend in adipose tissue of PCOS patients [18]. The opposing pattern of the miRNAs and mRNAs identified through target prediction software asserted the existence of strong miRNA mediation in PCOS. The PCOS transcriptome of peripheral blood showed the following percentage of similarity with other PCOS tissues; whole ovary (9%), ovarian granulosa cells (22%), ovarian theca cells (5%), oocytes (3.3%), endometrial tissue (2%) and adipose tissue (6%) (Supplementary Figure S2). This suggests that changes in the tissue get mirrored in circulating blood and thus can be of clinical diagnosis by using them as biomarkers.
Transcriptome as well as miRNA-transcriptome analysis identified the miRNA dependent and independent regulatory pathways involved in PCOS pathogenesis. Both the two types of analyses revealed similar pathways. Malfunctioning of these pathways viz. T cell signaling, B cell signaling, CDC42 signaling, MAPK signaling, apoptosis, cytoskeletal reorganization, integrin signaling and anandamide degradation can have serious perpetration on PCOS women (shown in Fig. 4D-F). Transcripts like MMP9, PLAUR and LAMA5 participate in cytoskeletal networking (shown in Fig. 5C). MMP9 expression is high in PCOS granulosa cells [19]. Thus our analysis identified pathways regulated by the miRNA-mRNA, which impart hints to novel downstream signal cross talk in PCOS. The FFL analysis revealed that the components had a strong association with many functional hallmarks in PCOS and identified16 sub clusters. Peptide hormone signaling (cluster 1) and steroid signaling (Cluster 2) are both established players in PCOS pathogenesis. Both these pathways exert the hormone action by modulating MAPK signaling (Cluster 14) directly.
The importance of Vitamin D, is apparent as our FFL analysis results due to LEF1 involvement being highlighted in a novel sub-cluster on ‘Response to vitamins and nutrition’ (Cluster 3). Vitamin D is similar to steroid hormones structurally and exerts its action via its receptor, Vitamin D receptor (VDR). VDR can bind directly to LEF1 via its DNA binding domain and boost Wnt signaling [20]. Of significance is the finding of Runx 2 in our Apoptosis and cell cycle regulation cluster as Runx 2 and VDR is known to interact and increase the VDRE mediated transactivation [21]. Increased Vitamin D is reported to suppress the over-expressed MAPK pathway [22] and improve the cytokine profile [23]. Since our analysis reveals an overexpressed MAPK signaling analyzing the status of vitamin D in PCOS is crucial.
Our analysis found an association between oxidative stress and angiogenesis (Cluster 4 & 13 respectively) with HIF1A targeting miRNAs hsa-miR-31 to be downregulated in angiogenesis cluster. Hsa-miR- 31, an upstream negative regulator of HIF1A is involved in angiogenesis [24]. Thus, a downregulated miR- 31 would result in increased HIF1A, in PCOS women which in turn would activate many hypoxia-induced miRNAs. HIF1A, the master regulator of hypoxia can activate many angiogenic factors [25] thereby modulating angiogenesis. The angiogenesis cluster is also associated with the Wnt signaling cluster (Cluster 5). Interestingly, increased Wnt is shown to elevate inflammation and oxidative stress in granulosa cells of PCOS patients [26]. Since MAPK is known to be involved in transactivation of HIF1A [27], oxidative stress and Wnt regulate MAPK in tandem which finally modulates angiogenesis.
Our network analysis of PCOS identified TPO (Cluster 6), EGF (Cluster 7) and PDGF (Cluster 8) clusters working via JAK-STAT (Cluster 9), and MAPK (Cluster 14). The upregulated HIF1A suggesting that they all coordinate to cause increased angiogenesis (Cluster 13) and hypervascularity characteristic of PCOS. The importance of the MAPK pathway in angiogenesis is further confirmed by the aggravation of the anti-angiogenic effects of mTOR inhibitors in conjunction with MAPK inhibitors [28]. Thus, the MAPK pathway (Cluster 14) is again at center stage taking instructions from a host of signaling cues and regulating angiogenesis.
Cluster 9 deals with JAK-STAT signaling. STAT1 activation involving second phosphorylation at Serine 727 occurs via MAPKs, MEK1 and SAPK (p38 and JNK)[29]. Activation of MAPK signaling(Cluster 14) is coupled with EGF signaling [30] while activation of STATs (STAT1 and STAT3 ) and JUN could alter TPO signaling(Cluster 6). PDGF signaling(Cluster 8), on one hand, regulates MAPK signaling(Cluster 14) and on the other hand, it regulates directly the IL signaling and T/B cell activation(Cluster 10). MAPK-JNK signaling can modulate the interleukin pathway through IL1β expression [31] and this is obvious in our network as IL1β is upregulated. The cluster contained down-regulation of hsa-miR-31 which can regulate the generation of T regulatory cells (Treg) frequency. Aberrant Treg frequency in PCOS women is recently reported by our group [32]. Along with that, the onset of PCOS is marked by low-grade inflammation which could be responsible for the observed metabolic and ovarian abnormalities [33, 34]. In addition, elevated infection rate in PCOS subjects [35] strengthen the formation of another important cluster ‘response to bacteriae’(Cluster 11). Thus, this sub-set of 5 sub-clusters strengthens the concept of aberrant immune regulation in PCOS.
Under the impact of various stimuli depicted in Cluster 1-8 of Fig. 9, the cell has to decide to live or undergo programmed cell death (apoptosis). Our analysis identified apoptosis and cell cycle regulation (Cluster 12) as an important cluster with an upregulated BCL6 - an anti-apoptotic gene suggesting loss of apoptosis in PCOS. This is possible as apoptosis is established to be regulated by MAPK signaling [36]. Apoptotic mechanisms are lost in PCOS[37] and cell death and cell proliferation rate are affected in granulosa cells of PCOS with downregulation of apoptotic mediators [38] causing accumulation of small antral follicles which are arrested in development. This premature arrest can be explained by the upregulated HtrA1 in our PCOS patients (shown in Fig. 4C) since oxidative stress can induce HtrA1 and cause premature cell senescence via the p38 MAPK pathway [39].
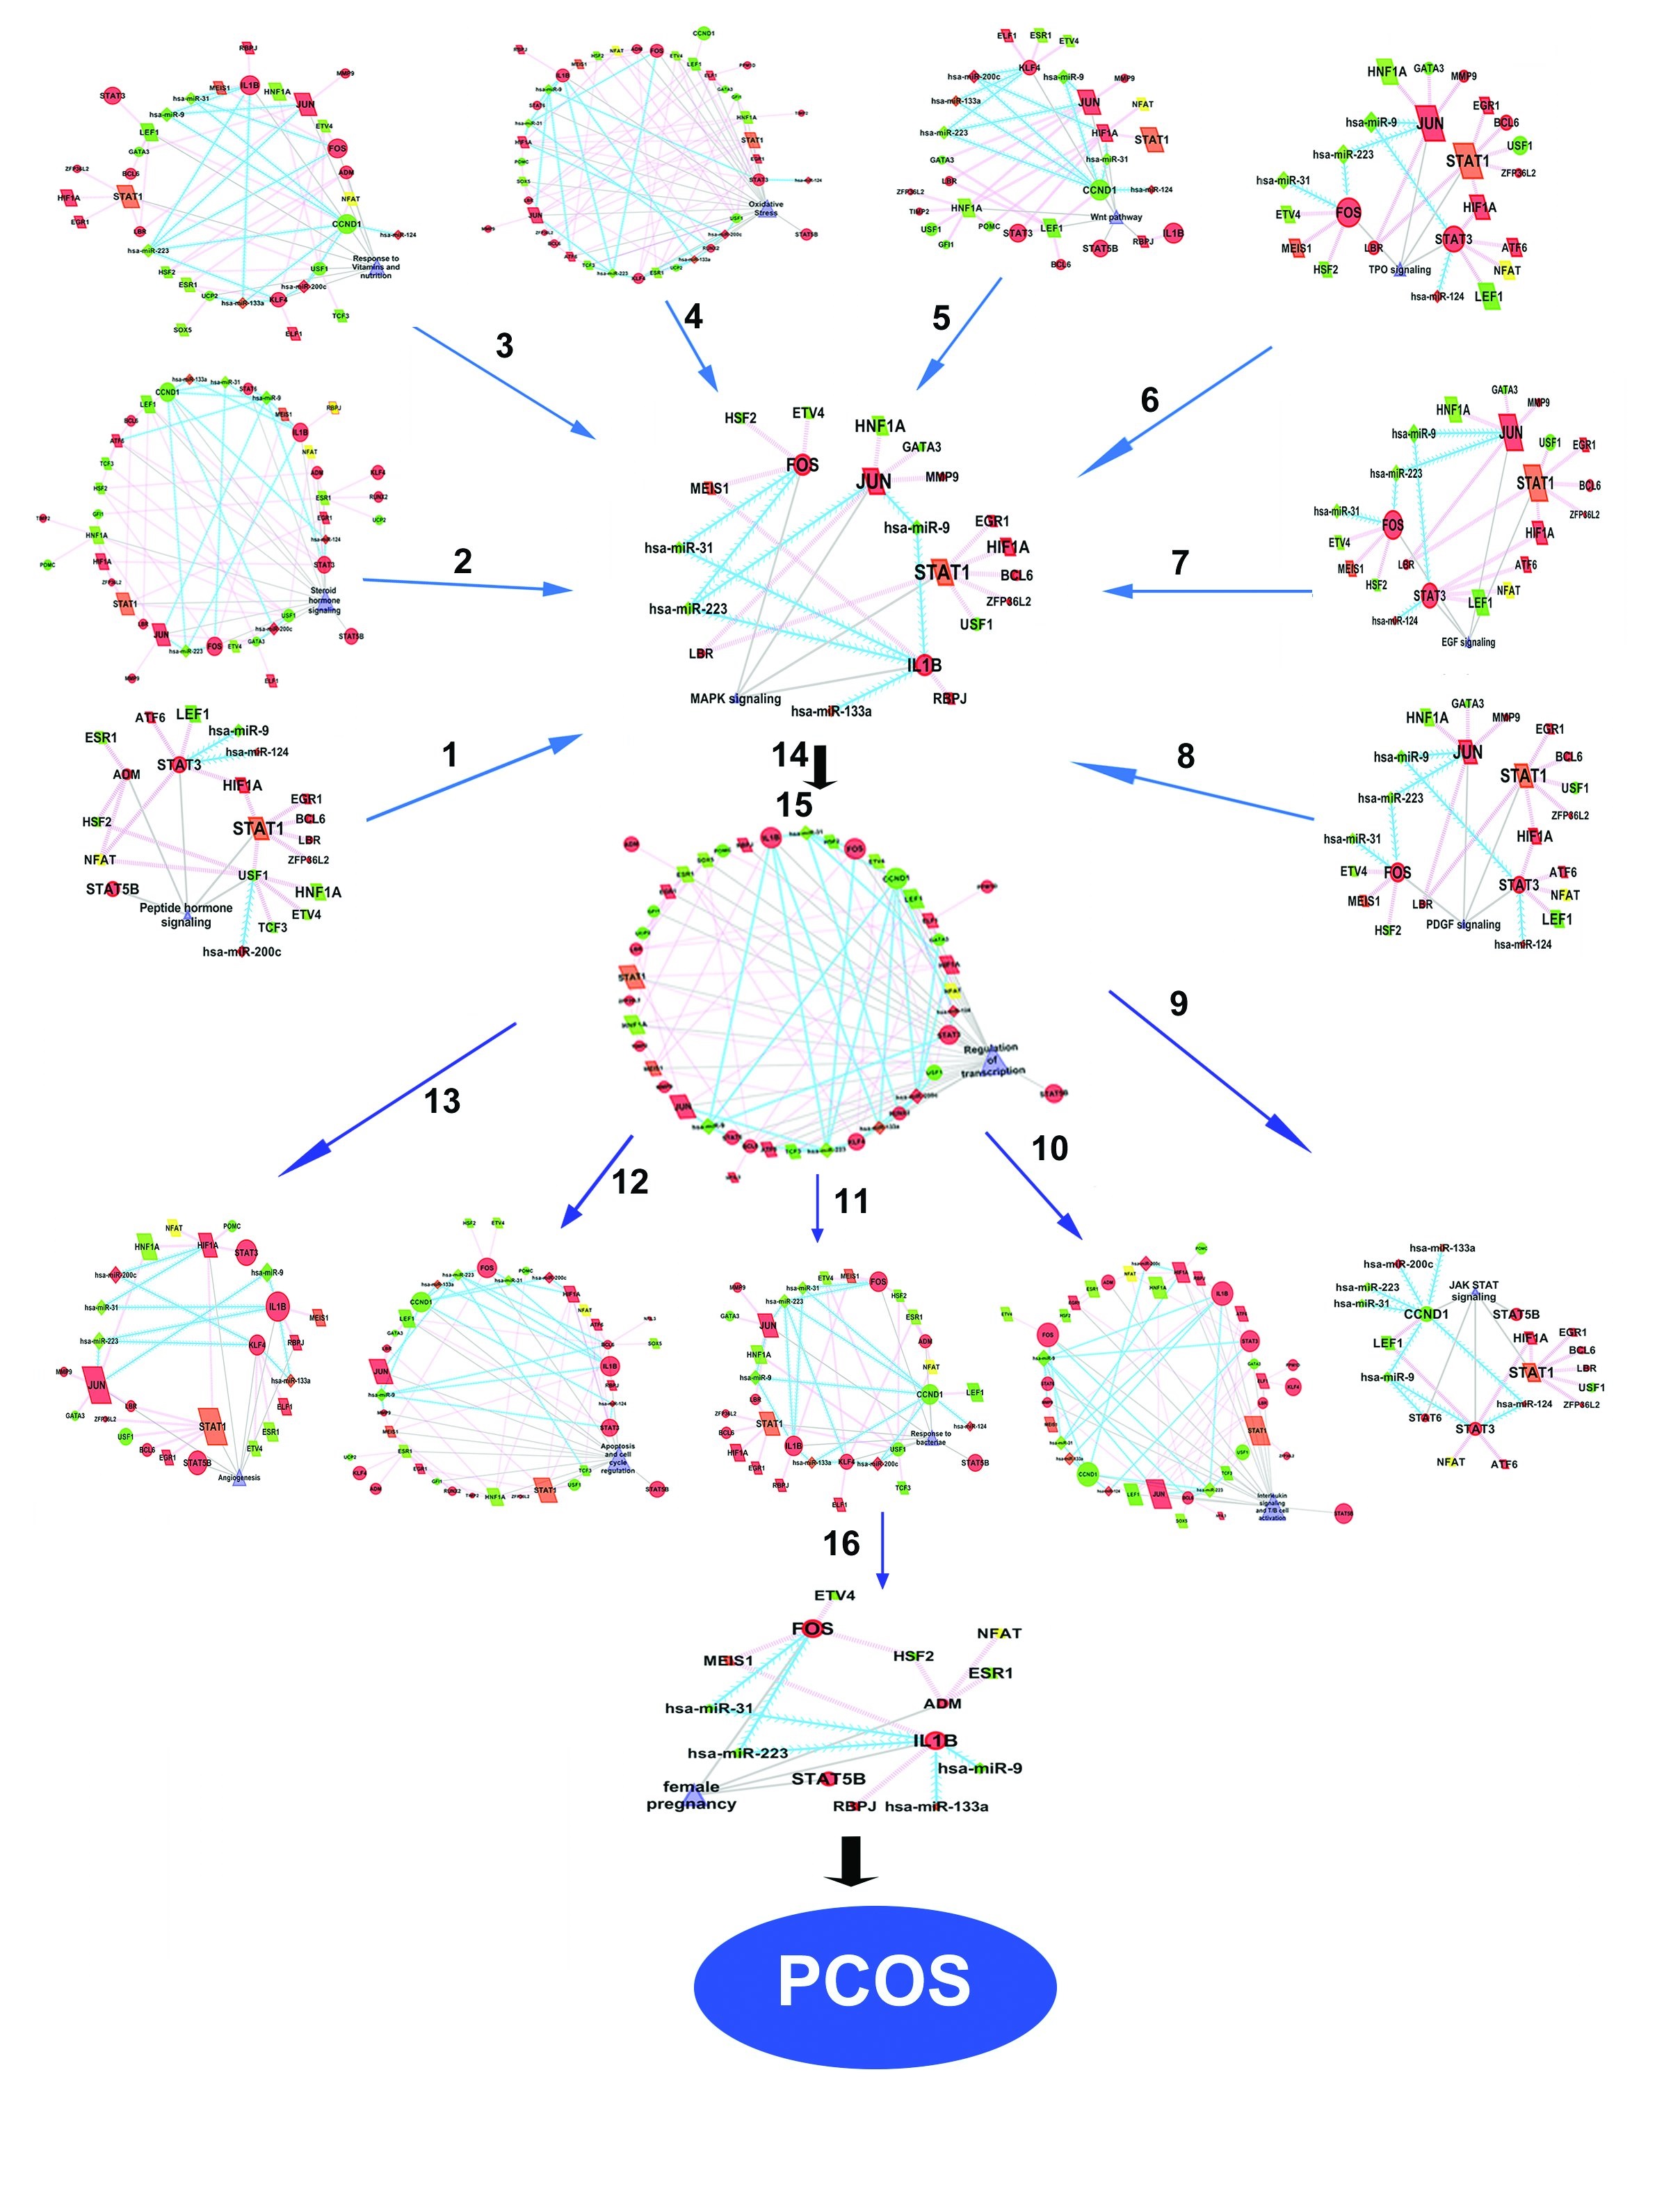
Fig. 9: Sub clusters (16) dissected from the key network using Cytoscape Plug-in. The functional group for the sub-clusters are Cluster 1 - ‘peptide hormone signaling’, Cluster 2- ‘steroid hormone signaling’, Cluster 3-‘response to vitamins and nutrition’, Cluster 4 - ‘oxidative stress’, Cluster 5 - ‘wnt pathway’, Cluster 6- ‘TPO signaling’, Cluster 7- ‘EGF signaling’,Cluster 8- ‘PDGF signaling’, Cluster 9- ‘JAK-STAT signaling’, Cluster 10-‘IL signaling and T/B cell activation', Cluster 11- ‘response to bacteriae’, Cluster 12- ‘apoptosis and cell cycle regulation’, Cluster 13 - ‘angiogenesis’, Cluster 14 - ‘MAPK’ cluster, Cluster 15 – ‘regulation of transcription’ and Cluster 16- ‘female pregnancy’. The clusters are dissected on the basis of their functions. The mRNAs are represented as circles, TFs as rectangles and miRNA as triangles. Red and green indicate up and down regulation respectively. The enriched functions associated with the network are merged in the Fig. 9. Blue and pink line indicate control mediated by miRNAs and control mediated by TFs.
Female pregnancy was another major cluster in the PCOS FFL (Cluster 16), with Fos being targeted by miR-31 and miR-223 while IL1β was under the control of miR-31, miR-223, miR-9 and miR-133a suggesting that these two represent key nodes in pregnancy failure in PCOS. PCOS ovaries are known to be deficient in c-fos leading to increased 17alpha-Hydroxylase (CYP17) expression [40], but our results show increased fos expression in blood and this could be due to increased IL1β expression as IL1β is known to stimulate fos expression [41]. Granulosa cells from PCOS patients show overexpression of inflammatory gene IL1β[42]. Thus, dysregulation in clusters 1-14 finally converges on pregnancy failure in PCOS patients.
The MAPK hub was regulated by diverse elicitors (represented by Clusters 1-8 in Fig. 9). The over-activated MAPK pathway due to these stimuli can explain a multitude of physiological responses aberrant in PCOS pathogenesis represented by clusters 10-14 culminating in impacting female pregnancy (Cluster 16). These leads to hyperandrogenemia, abnormal proliferation, vascularisation, inflammation in conjunction with aberrant immune signaling via transcriptional regulation (Cluster 15) including JNK and JAK-STAT pathway.
Aberrant MAPK signaling was found to be linked with several human disease conditions including Alzheimer’s disease (AD), cancer [43], diabetes [44]and obesity [45]. Moreover, recent studies have identified impaired MAPK activation in PCOS. Interestingly another study revealed activated ERK signaling in skeletal muscle of PCOS patients which can further add to insulin resistance in those patients [46]. Also, SNPs of MAPKs- ERK2 and MEK1 -were associated with PCOS susceptibility [47]. Cumulus cells (CCs) and mural granulosa cells (MGCs) of the PCOS ovary showed deregulated MAPK pathway as a causative factor for defective oocyte and follicle development [48]. Microarray analysis conducted in granulosa cells of PCOS women identified MAPK/ERK pathway to be differentially expressed, with a reduced ERK activation in PCOS patients [49]. This observation is in line with our results of decreased expression of both total and activated ERK in PBMCs of PCOS women (shown in Fig. 10B-C). Moreover, it has been shown that reduced levels of ERK1/2 are linked with the elevated androgen synthesis in thecal cells of women with PCOS [50]. miRNA, mRNA profiling in cumulus cells of PCOS women with IR also identified miRNA’s regulating MAPK pathway to be enriched [51]. Kobayashi et al., reported that dysregulated autophagy in bovine theca cells could induce fibrosis and androgen synthesis via reactive oxygen species-dependent p38/JNK cascade [52]. Thus, increased p38/JNK levels in peripheral blood of PCOS women observed in our data could be linked to the associated hyperandrogenemia (shown in Fig. 10 D-E).Our data bear out an aberrant MAPK signaling in PCOS patients which could play a central role in reproductive, metabolic as well as other pathogenesis of PCOS.
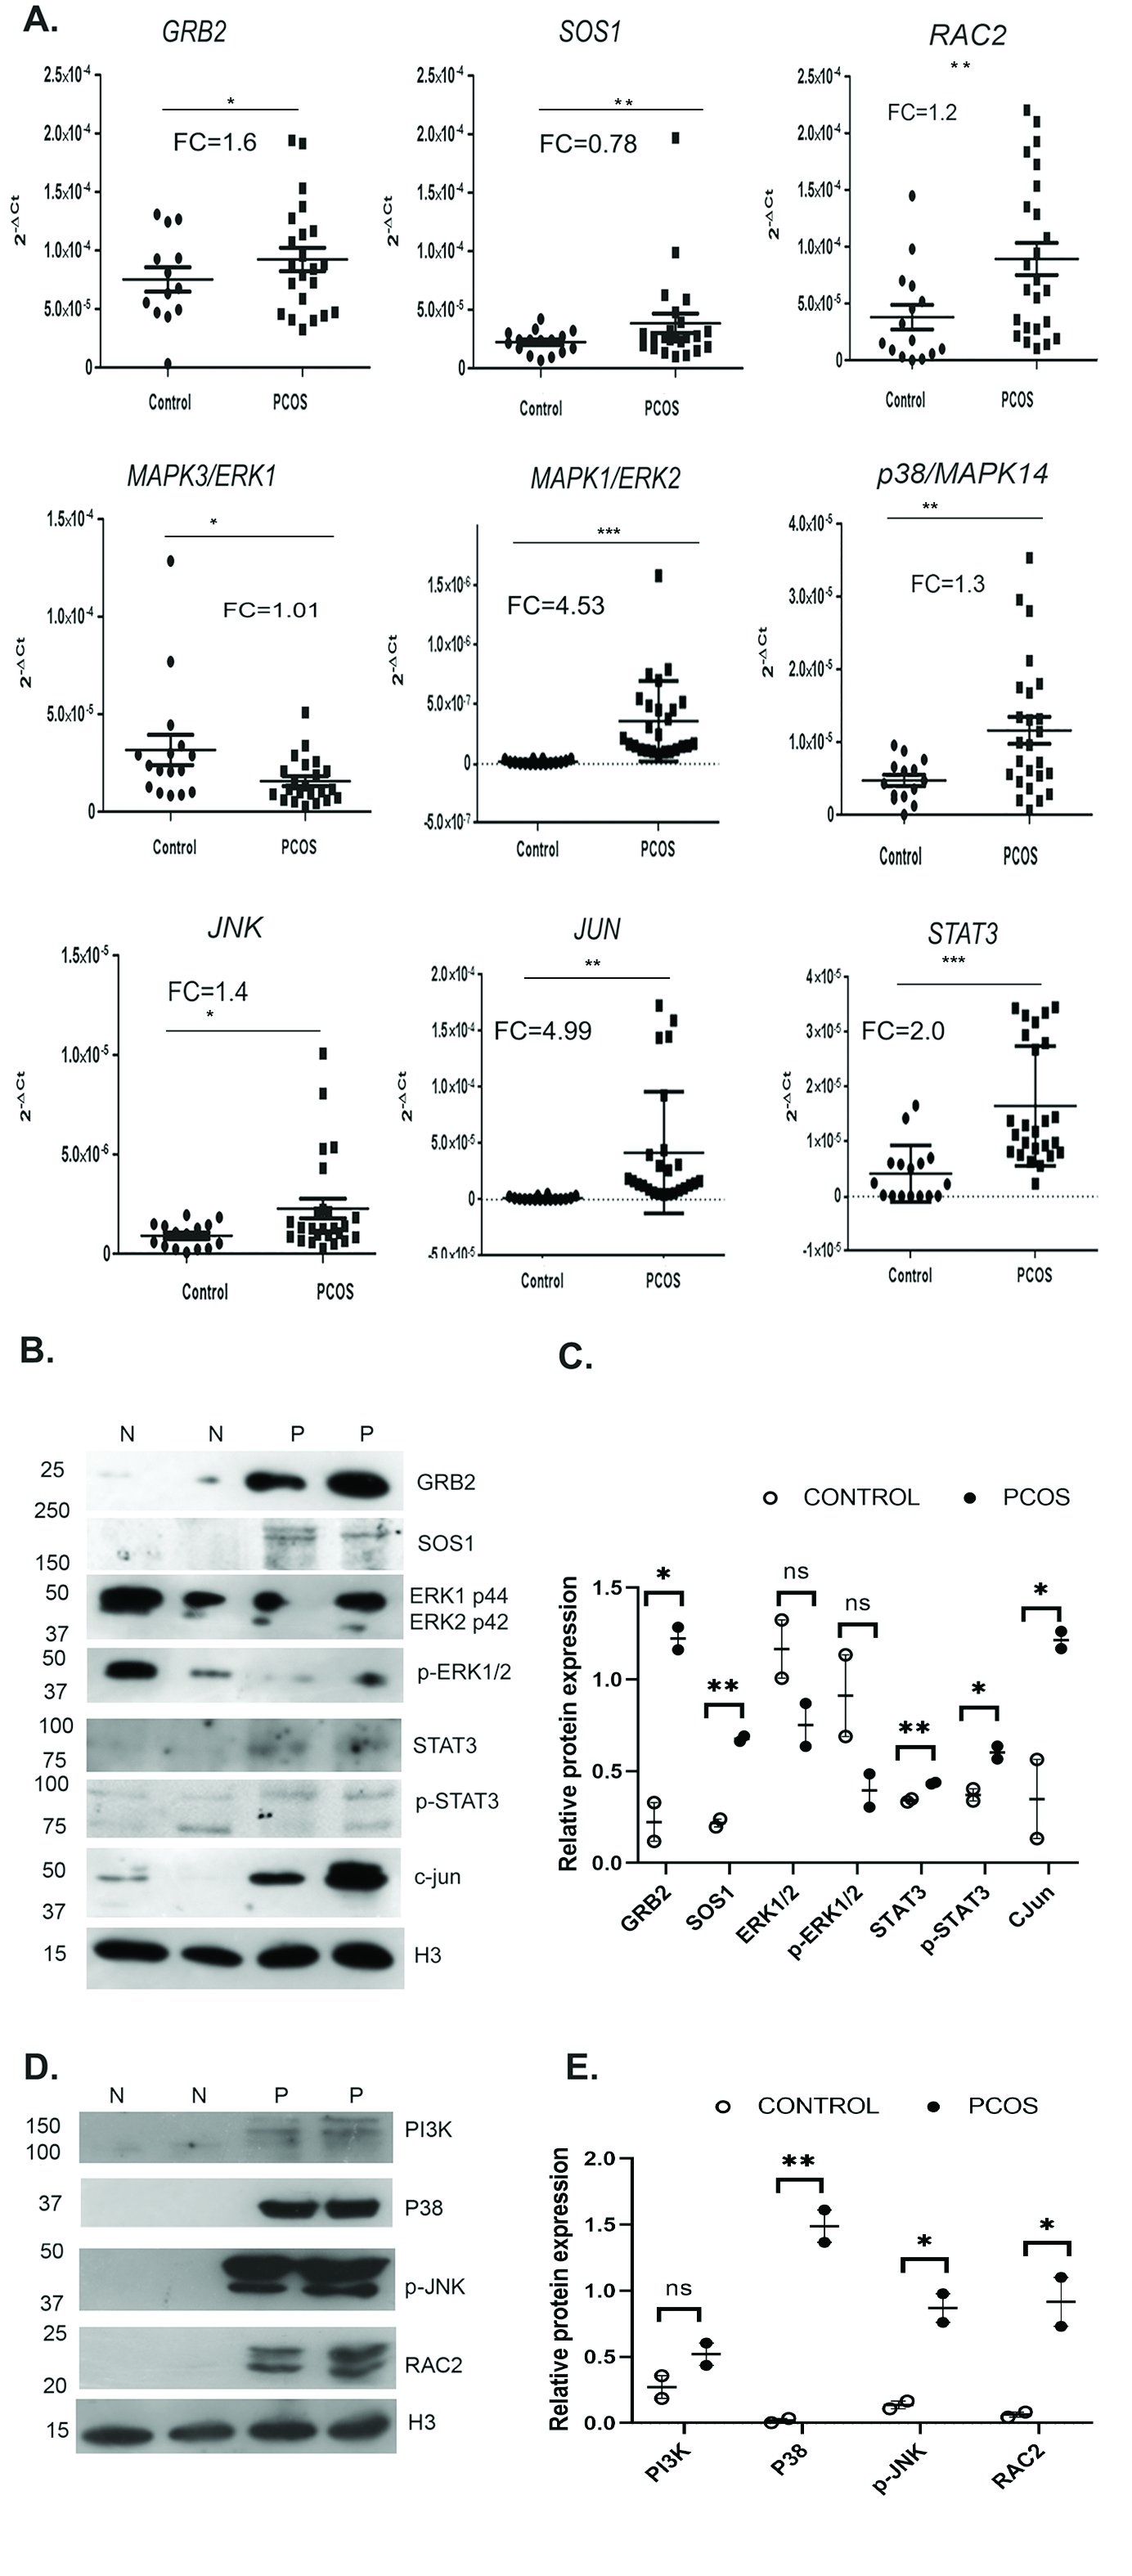
Fig. 10: MAPK pathway in PCOS is activated through P38- JNK: A) Dot plot representation of the relative expression of GRB2, SOS1, RAC2, MAPK3/ERK1, MAPK1/ERK2, p38/MAPK14, JNK, JUN and STAT3 transcripts in normal (n=16) and PCOS women (n=25). The 2-ΔCt values are plotted in Y axis of dot plots. The RQ (2-ΔΔCt) was calculated according to ΔΔCt method using 18SrRNA as the endogenous control. Fold Change (FC) is represented as log2RQ A single real-time experiment was performed for each subject and transcript with the transcripts runs in triplicates. Statistical analysis was done using GraphPad Prism 6. B) Western blot analysis of SOS1, GRB2, ERK1/2, pERK1/2, STAT3, pSTAT3 and c-JUN in PBMC extracts of normal (Lane 1&2) and PCOS women (Lane 3&4) showing increased expression of SOS1, GRB2, STAT3, pSTAT3 and c-JUN, and ERK1/2 and pERK1/2 showing decreased expression in PCOS when compared to normal. H3 was used as an internal control for comparison. C) Protein quantitation is represented by bar diagram. D) Western blot analysis of PI3K, P38, p-JNK and RAC2 in PBMC extracts of normal and PCOS women represented an increased expression in PCOS than in the control group. H3 was used as the internal control for comparison. E) Western blot quantitation is represented by bar diagram. P values less than 0.05 was considered to be statistically significant. (*p-value ≤ 0.05 and **p-value ≤ 0.01).
Conclusion
Thus, MAPK signaling represents a core cluster that can act as a junctional hub connecting multiple signaling pathways (elicitors and effectors) contributing to PCOS pathogenesis. The integrated miRNA and mRNA expression signature of PCOS reveals novel insights into its pathogenesis. They act as regulators of multiple molecular circuits in the physiological system with MAPK as the hub. A schematic representation of the summary of the integrated network in PCOS pathobiology is shown in Fig. 11. Since MAPK signaling functions as the nucleus of these circuits targeting the MAPK pathway could represent a new line of therapy to manage PCOS and its complications.
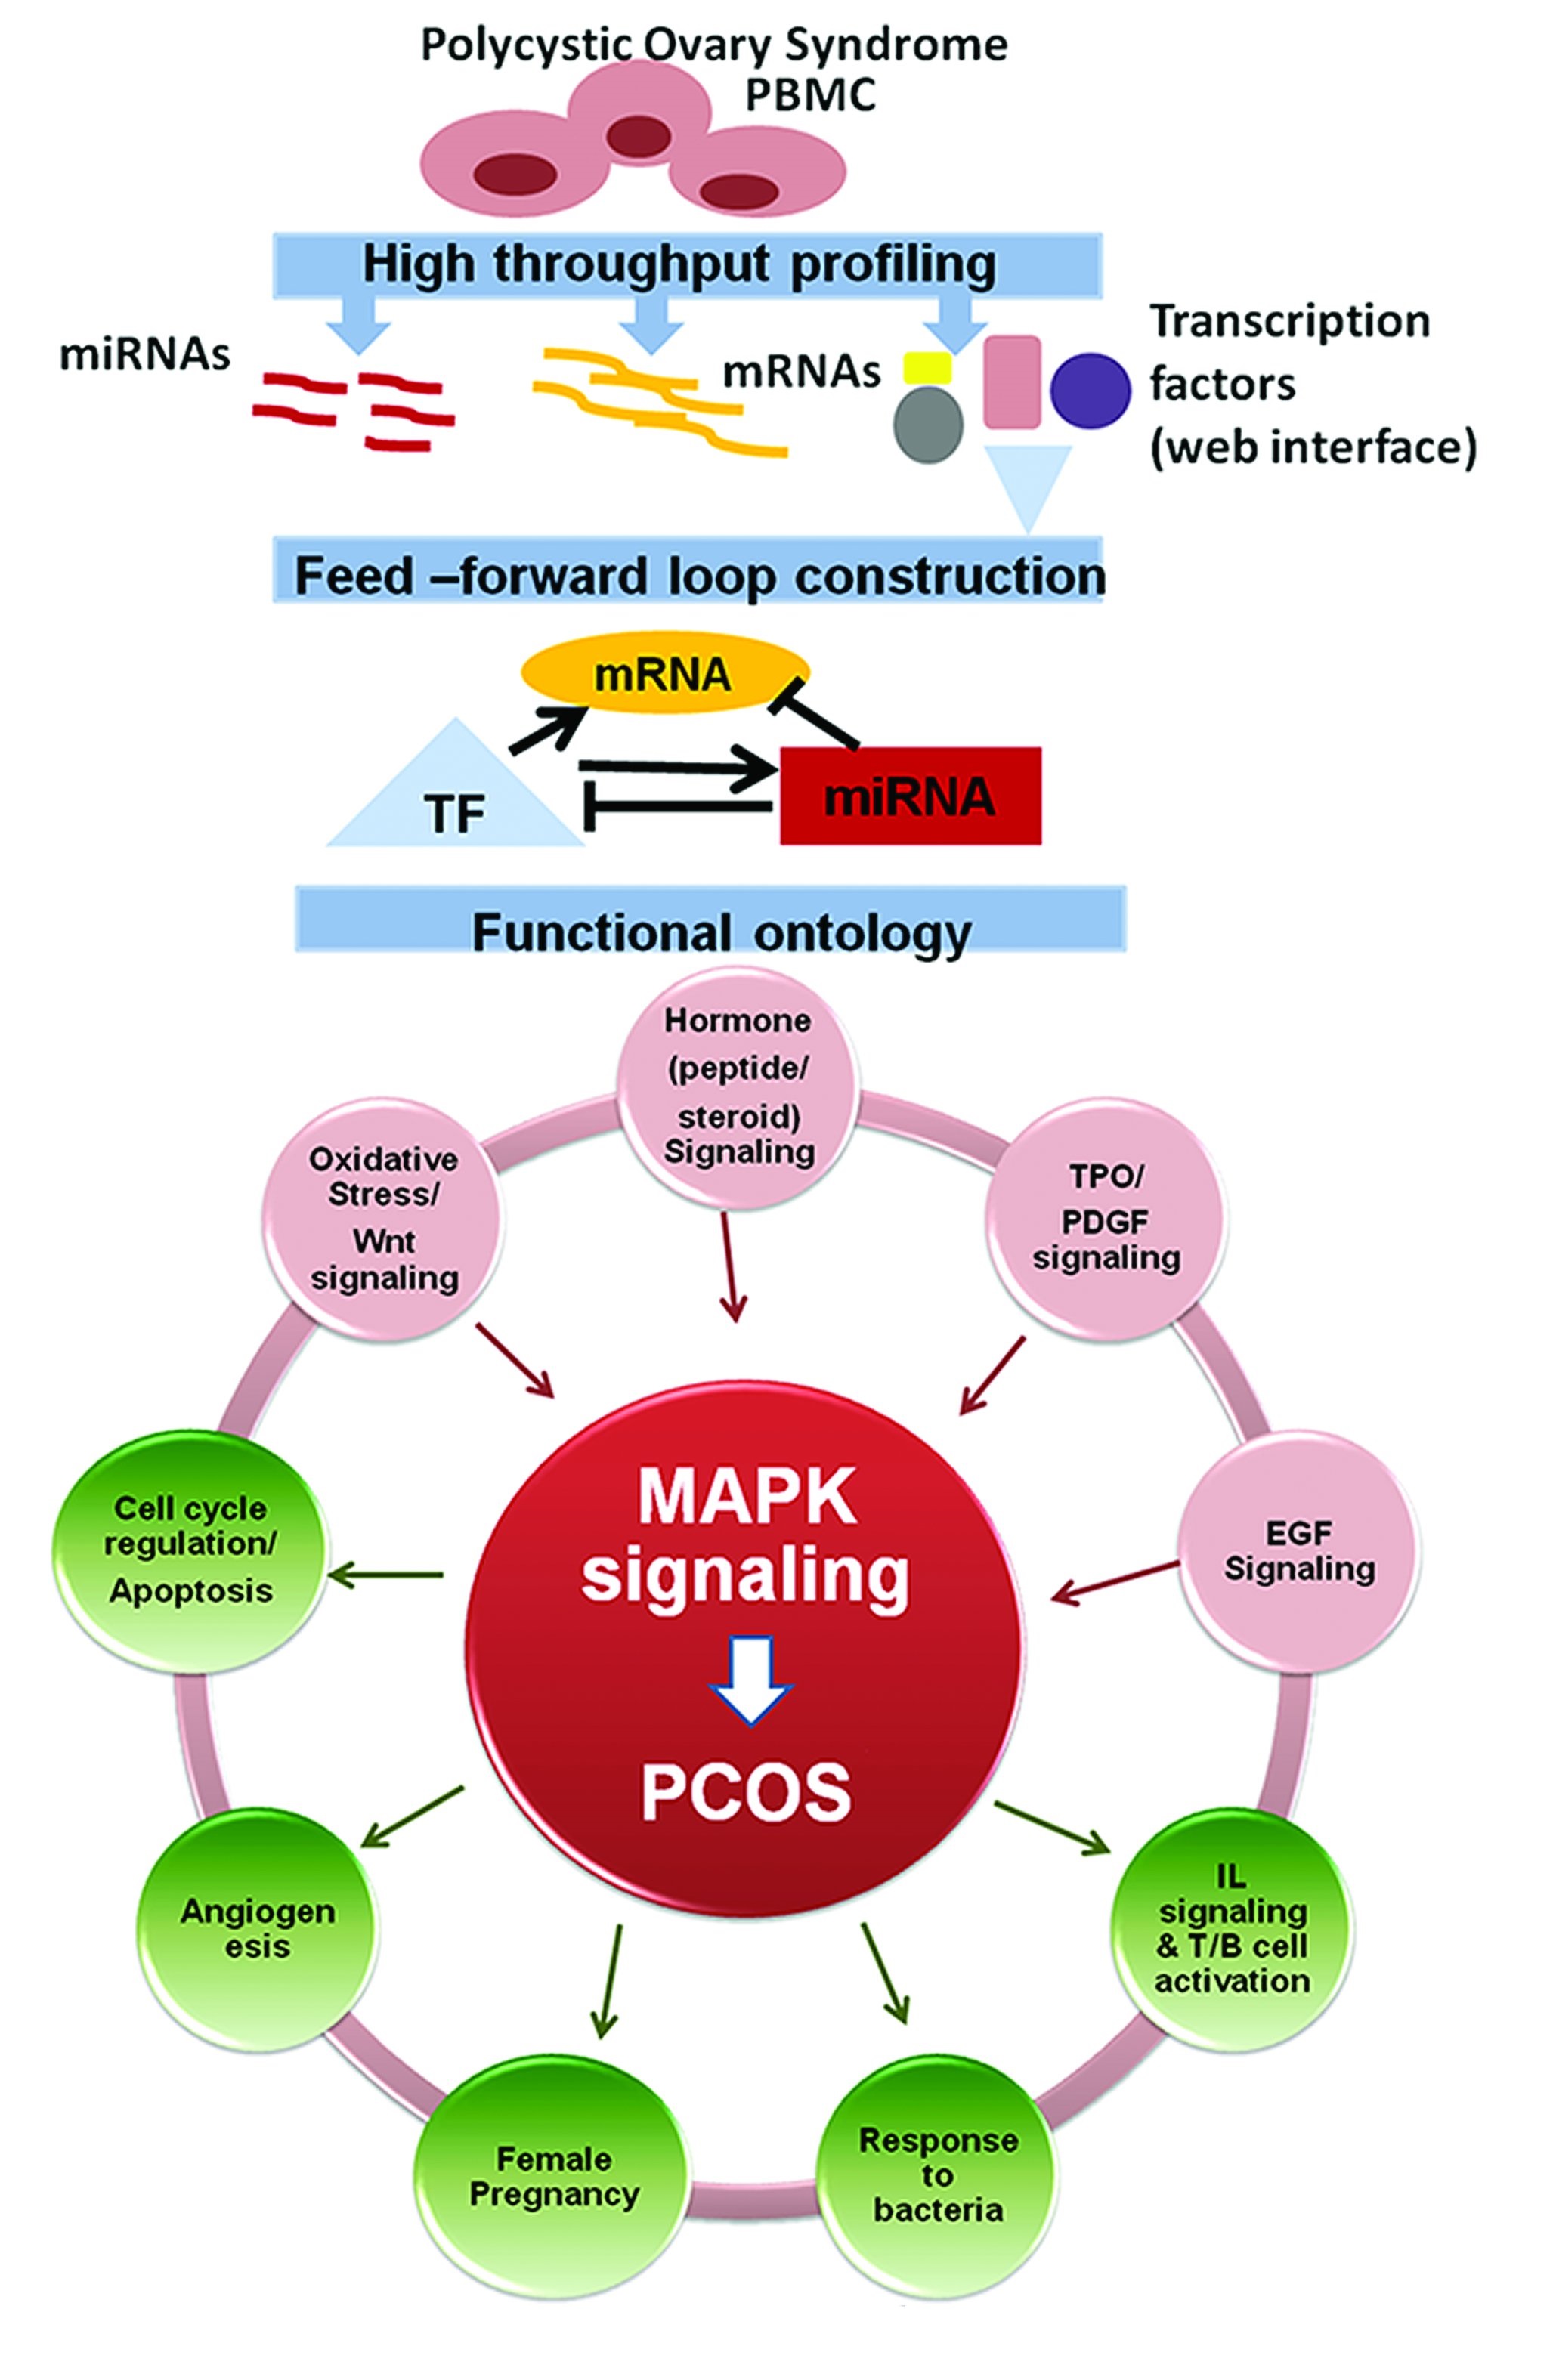
Fig. 11: Summary illustration of integrated network in PCOS pathobiology.
Acknowledgements
Funding
This work was supported by RGCB-DBT Core Funds to Dr. Malini Laloraya. Meera Krishna B. by CSIR Research Fellowship (10.2(5)/2007(ii).E.U.II)., Betcy Susan Johnson was supported by a DST/INSPIRE Fellowship/2015/IF150361.
Author contributions
ML contributed to project conception, study design, critical discussions, supervision and manuscript review.
MKB contributed to study design, execution of experiments, acquisition of data, analysis and interpretation of data for Figures 2-4, manuscript drafting and critical discussions. MKB and MV are responsible for the bioinformatic analysis of the data in Fig. 2D, 4D-F, 5-9. BSJ contributed to acquisition of data, its analysis and data interpretation for Fig. 10. ML and BSJ contributed to designing of Fig. 1. ML contributed to designing of Fig. 11. SMP contributed to the diagnosis and recruitment of PCOS patients. All authors discussed the results, read and approved the final manuscript. We acknowledge Labindia, Gurgaon for miRNA TLDA expression profiling. The authors would like to thank the support of Staff at SAMAD IVF Hospital in patient recruitment and patient data management.
The study was approved by Rajiv Gandhi Centre for Biotechnology’s Institutional Ethical Committee (IHEC/2/2009/13) and SAMAD IVF Ethical committee.
Data Availability Statement
The data supporting the observations of the study are available within the article and its supplementary materials.
Disclosure Statement
The authors declare no competing financial interests.
References
| 1 |
Nelson VL, Qin KN, Rosenfield RL, Wood JR, Penning TM, Legro RS, Strauss JF, 3rd, McAllister JM: The biochemical basis for increased testosterone production in theca cells propagated from patients with polycystic ovary syndrome. J Clin Endocrinol Metab 2001;86:5925-5933.
https://doi.org/10.1210/jcem.86.12.8088 |
| 2 |
Dunaif A, Wu X, Lee A, Diamanti-Kandarakis E: Defects in insulin receptor signaling in vivo in the polycystic ovary syndrome (PCOS). Am J Physiol Endocrinol Metab 2001;281:E392-399.
https://doi.org/10.1152/ajpendo.2001.281.2.E392 |
| 3 |
Welt CK, Duran JM: Genetics of polycystic ovary syndrome. Semin Reprod Med 2014;32:177-182.
https://doi.org/10.1055/s-0034-1371089 |
| 4 |
Corton M, Botella-Carretero JI, Benguria A, Villuendas G, Zaballos A, San Millan JL, Escobar-Morreale HF, Peral B: Differential gene expression profile in omental adipose tissue in women with polycystic ovary syndrome. J Clin Endocrinol Metab 2007;92:328-337.
https://doi.org/10.1210/jc.2006-1665 |
| 5 |
Goumenou AG, Matalliotakis IM, Koumantakis GE, Panidis DK: The role of leptin in fertility. Eur J Obstet Gynecol Reprod Biol 2003;106:118-124.
https://doi.org/10.1016/S0301-2115(02)00359-7 |
| 6 |
Bartel DP: MicroRNAs: genomics, biogenesis, mechanism, and function. Cell 2004;116:281-297.
https://doi.org/10.1016/S0092-8674(04)00045-5 |
| 7 |
Roth LW, McCallie B, Alvero R, Schoolcraft WB, Minjarez D, Katz-Jaffe MG: Altered microRNA and gene expression in the follicular fluid of women with polycystic ovary syndrome. J Assist Reprod Genet 2014;31:355-362.
https://doi.org/10.1007/s10815-013-0161-4 |
| 8 |
Sang Q, Yao Z, Wang H, Feng R, Wang H, Zhao X, Xing Q, Jin L, He L, Wu L, Wang L: Identification of microRNAs in human follicular fluid: characterization of microRNAs that govern steroidogenesis in vitro and are associated with polycystic ovary syndrome in vivo . J Clin Endocrinol Metab 2013;98:3068-3079.
https://doi.org/10.1210/jc.2013-1715 |
| 9 |
Ding CF, Chen WQ, Zhu YT, Bo YL, Hu HM, Zheng RH: Circulating microRNAs in patients with polycystic ovary syndrome. Hum Fertil (Camb) 2015;18:22-29.
https://doi.org/10.3109/14647273.2014.956811 |
| 10 |
Long W, Zhao C, Ji C, Ding H, Cui Y, Guo X, Shen R, Liu J: Characterization of serum microRNAs profile of PCOS and identification of novel non-invasive biomarkers. Cell Physiol Biochem 2014;33:1304-1315.
https://doi.org/10.1159/000358698 |
| 11 |
Peng C, Wang M, Shen Y, Feng H, Li A: Reconstruction and analysis of transcription factor-miRNA co-regulatory feed-forward loops in human cancers using filter-wrapper feature selection. PLoS One 2013;8:e78197.
https://doi.org/10.1371/journal.pone.0078197 |
| 12 |
Eduati F, Di Camillo B, Karbiener M, Scheideler M, Cora D, Caselle M, Toffolo G: Dynamic modeling of miRNA-mediated feed-forward loops. J Comput Biol 2012;19:188-199.
https://doi.org/10.1089/cmb.2011.0274 |
| 13 |
Tsang J, Zhu J, van Oudenaarden A: MicroRNA-mediated feedback and feedforward loops are recurrent network motifs in mammals. Mol Cell 2007;26:753-767.
https://doi.org/10.1016/j.molcel.2007.05.018 |
| 14 |
Le DH, Kwon YK: A coherent feedforward loop design principle to sustain robustness of biological networks. Bioinformatics 2013;29:630-637.
https://doi.org/10.1093/bioinformatics/btt026 |
| 15 |
Li Y, Liang C, Easterbrook S, Luo J, Zhang Z: Investigating the functional implications of reinforcing feedback loops in transcriptional regulatory networks. Mol Biosyst 2014;10:3238-3248.
https://doi.org/10.1039/C4MB00526K |
| 16 |
Rotterdam EA-SPCWG: Revised 2003 consensus on diagnostic criteria and long-term health risks related to polycystic ovary syndrome. Fertil Steril 2004;81:19-25.
https://doi.org/10.1016/j.fertnstert.2003.10.004 |
| 17 |
Son BK, Roberts RL, Ank BJ, Stiehm ER: Effects of anticoagulant, serum, and temperature on the natural killer activity of human peripheral blood mononuclear cells stored overnight. Clin Diagn Lab Immunol 1996;3:260-264.
https://doi.org/10.1128/cdli.3.3.260-264.1996 |
| 18 |
Chen YH, Heneidi S, Lee JM, Layman LC, Stepp DW, Gamboa GM, Chen BS, Chazenbalk G, Azziz R: miRNA-93 inhibits GLUT4 and is overexpressed in adipose tissue of polycystic ovary syndrome patients and women with insulin resistance. Diabetes 2013;62:2278-2286.
https://doi.org/10.2337/db12-0963 |
| 19 |
Shalev E, Goldman S, Ben-Shlomo I: The balance between MMP-9 and MMP-2 and their tissue inhibitor (TIMP)-1 in luteinized granulosa cells: comparison between women with PCOS and normal ovulatory women. Mol Hum Reprod 2001;7:325-331.
https://doi.org/10.1093/molehr/7.4.325 |
| 20 |
Luderer HF, Gori F, Demay MB: Lymphoid enhancer-binding factor-1 (LEF1) interacts with the DNA-binding domain of the vitamin D receptor. J Biol Chem 2011;286:18444-18451.
https://doi.org/10.1074/jbc.M110.188219 |
| 21 |
Paredes R, Arriagada G, Cruzat F, Villagra A, Olate J, Zaidi K, van Wijnen A, Lian JB, Stein GS, Stein JL, Montecino M: Bone-specific transcription factor Runx2 interacts with the 1alpha,25-dihydroxyvitamin D3 receptor to up-regulate rat osteocalcin gene expression in osteoblastic cells. Mol Cell Biol 2004;24:8847-8861.
https://doi.org/10.1128/MCB.24.20.8847-8861.2004 |
| 22 |
Meeker S, Seamons A, Paik J, Treuting PM, Brabb T, Grady WM, Maggio-Price L: Increased dietary vitamin D suppresses MAPK signaling, colitis, and colon cancer. Cancer Res 2014;74:4398-4408.
https://doi.org/10.1158/0008-5472.CAN-13-2820 |
| 23 |
Schleithoff SS, Zittermann A, Tenderich G, Berthold HK, Stehle P, Koerfer R: Vitamin D supplementation improves cytokine profiles in patients with congestive heart failure: a double-blind, randomized, placebo-controlled trial. Am J Clin Nutr 2006;83:754-759.
https://doi.org/10.1093/ajcn/83.4.754 |
| 24 |
Suarez Y, Sessa WC: MicroRNAs as novel regulators of angiogenesis. Circ Res 2009;104:442-454.
https://doi.org/10.1161/CIRCRESAHA.108.191270 |
| 25 |
Pugh CW, Ratcliffe PJ: Regulation of angiogenesis by hypoxia: role of the HIF system. Nat Med 2003;9:677-684.
https://doi.org/10.1038/nm0603-677 |
| 26 |
Zhao Y, Zhang C, Huang Y, Yu Y, Li R, Li M, Liu N, Liu P, Qiao J: Up-regulated expression of WNT5a increases inflammation and oxidative stress via PI3K/AKT/NF-kappaB signaling in the granulosa cells of PCOS patients. J Clin Endocrinol Metab 2015;100:201-211.
https://doi.org/10.1210/jc.2014-2419 |
| 27 |
Sang N, Stiehl DP, Bohensky J, Leshchinsky I, Srinivas V, Caro J: MAPK signaling up-regulates the activity of hypoxia-inducible factors by its effects on p300. J Biol Chem 2003;278:14013-14019.
https://doi.org/10.1074/jbc.M209702200 |
| 28 |
Dormond-Meuwly A, Roulin D, Dufour M, Benoit M, Demartines N, Dormond O: The inhibition of MAPK potentiates the anti-angiogenic efficacy of mTOR inhibitors. Biochem Biophys Res Commun 2011;407:714-719.
https://doi.org/10.1016/j.bbrc.2011.03.086 |
| 29 |
Zhang Y, Cho YY, Petersen BL, Zhu F, Dong Z: Evidence of STAT1 phosphorylation modulated by MAPKs, MEK1 and MSK1. Carcinogenesis 2004;25:1165-1175.
https://doi.org/10.1093/carcin/bgh115 |
| 30 |
Corcoran RB, Ebi H, Turke AB, Coffee EM, Nishino M, Cogdill AP, Brown RD, Della Pelle P, Dias-Santagata D, Hung KE, Flaherty KT, Piris A, Wargo JA, Settleman J, Mino-Kenudson M, Engelman JA: EGFR-mediated re-activation of MAPK signaling contributes to insensitivity of BRAF mutant colorectal cancers to RAF inhibition with vemurafenib. Cancer Discov 2012;2:227-235.
https://doi.org/10.1158/2159-8290.CD-11-0341 |
| 31 |
Henley DV, Bellone CJ, Williams DA, Ruh MF: MAPK signaling pathways modulate IL-1beta expression in human keratinocytes. Arch Biochem Biophys 2004;424:112-118.
https://doi.org/10.1016/j.abb.2004.02.001 |
| 32 |
Krishna MB, Joseph A, Subramaniam AG, Gupta A, Pillai SM, Laloraya M: Reduced Tregs in peripheral blood of PCOS patients - a consequence of aberrant Il2 signaling. J Clin Endocrinol Metab 2015;100:282-292.
https://doi.org/10.1210/jc.2014-2401 |
| 33 |
Ebejer K, Calleja-Agius J: The role of cytokines in polycystic ovarian syndrome. Gynecol Endocrinol 2013;29:536-540.
https://doi.org/10.3109/09513590.2012.760195 |
| 34 |
Kelly CC, Lyall H, Petrie JR, Gould GW, Connell JM, Sattar N: Low grade chronic inflammation in women with polycystic ovarian syndrome. J Clin Endocrinol Metab 2001;86:2453-2455.
https://doi.org/10.1210/jcem.86.6.7580 |
| 35 |
Marquez-Arrico CF, Silvestre-Rangil J, Gutierrez-Castillo L, Martinez-Herrera M, Silvestre FJ, Rocha M: Association between Periodontal Diseases and Polycystic Ovary Syndrome: A Systematic Review. J Clin Med 2020;9:1586.
https://doi.org/10.3390/jcm9051586 |
| 36 |
Wada T, Penninger JM: Mitogen-activated protein kinases in apoptosis regulation. Oncogene 2004;23:2838-2849.
https://doi.org/10.1038/sj.onc.1207556 |
| 37 |
Homburg R, Amsterdam A: Polysystic ovary syndrome--loss of the apoptotic mechanism in the ovarian follicles? J Endocrinol Invest 1998;21:552-557.
https://doi.org/10.1007/BF03350780 |
| 38 |
Das M, Djahanbakhch O, Hacihanefioglu B, Saridogan E, Ikram M, Ghali L, Raveendran M, Storey A: Granulosa cell survival and proliferation are altered in polycystic ovary syndrome. J Clin Endocrinol Metab 2008;93:881-887.
https://doi.org/10.1210/jc.2007-1650 |
| 39 |
Supanji, Shimomachi M, Hasan MZ, Kawaichi M, Oka C: HtrA1 is induced by oxidative stress and enhances cell senescence through p38 MAPK pathway. Exp Eye Res 2013;112:79-92.
https://doi.org/10.1016/j.exer.2013.04.013 |
| 40 |
Patel SS, Beshay VE, Escobar JC, Carr BR: 17alpha-Hydroxylase (CYP17) expression and subsequent androstenedione production in the human ovary. Reprod Sci 2010;17:978-986.
https://doi.org/10.1177/1933719110379055 |
| 41 |
Tjwa ET, Bradley JM, Keenan CM, Kroese AB, Sharkey KA: Interleukin-1beta activates specific populations of enteric neurons and enteric glia in the guinea pig ileum and colon. Am J Physiol Gastrointest Liver Physiol 2003;285:1268-1276.
https://doi.org/10.1152/ajpgi.00073.2003 |
| 42 |
Schmidt J, Weijdegard B, Mikkelsen AL, Lindenberg S, Nilsson L, Brannstrom M: Differential expression of inflammation-related genes in the ovarian stroma and granulosa cells of PCOS women. Mol Hum Reprod 2014;20:49-58.
https://doi.org/10.1093/molehr/gat051 |
| 43 |
Kim EK, Choi EJ: Pathological roles of MAPK signaling pathways in human diseases. Biochim Biophys Acta 2010;1802:396-405.
https://doi.org/10.1016/j.bbadis.2009.12.009 |
| 44 |
Gogg S, Smith U, Jansson PA: Increased MAPK activation and impaired insulin signaling in subcutaneous microvascular endothelial cells in type 2 diabetes: the role of endothelin-1. Diabetes 2009;58:2238-2245.
https://doi.org/10.2337/db08-0961 |
| 45 |
Hirosumi J, Tuncman G, Chang L, Gorgun CZ, Uysal KT, Maeda K, Karin M, Hotamisligil GS: A central role for JNK in obesity and insulin resistance. Nature 2002;420:333-336.
https://doi.org/10.1038/nature01137 |
| 46 |
Corbould A, Zhao H, Mirzoeva S, Aird F, Dunaif A: Enhanced mitogenic signaling in skeletal muscle of women with polycystic ovary syndrome. Diabetes 2006;55:751-759.
https://doi.org/10.2337/diabetes.55.03.06.db05-0453 |
| 47 |
Hu L, Zhang Y, Chen L, Zhou W, Wang Y, Wen J: MAPK and ERK polymorphisms are associated with PCOS risk in Chinese women. Oncotarget 2017;8:100261-10068.
https://doi.org/10.18632/oncotarget.22153 |
| 48 |
Aydos A, Gurel A, Oztemur Islakoglu Y, Noyan S, Gokce B, Ecemis T, Kaya C, Aksu AT, Gur Dedeoglu B: Identification of Polycystic Ovary Syndrome (PCOS) Specific Genes in Cumulus and Mural Granulosa Cells. PLoS One 2016;11:e0168875.
https://doi.org/10.1371/journal.pone.0168875 |
| 49 |
Lan CW, Chen MJ, Tai KY, Yu DC, Yang YC, Jan PS, Yang YS, Chen HF, Ho HN: Functional microarray analysis of differentially expressed genes in granulosa cells from women with polycystic ovary syndrome related to MAPK/ERK signaling. Sci Rep 2015;5:14994.
https://doi.org/10.1038/srep14994 |
| 50 |
Nelson-Degrave VL, Wickenheisser JK, Hendricks KL, Asano T, Fujishiro M, Legro RS, Kimball SR, Strauss JF, 3rd, McAllister JM: Alterations in mitogen-activated protein kinase kinase and extracellular regulated kinase signaling in theca cells contribute to excessive androgen production in polycystic ovary syndrome. Mol Endocrinol 2005;19:379-390.
https://doi.org/10.1210/me.2004-0178 |
| 51 |
Hu MH, Zheng SX, Yin H, Zhu XY, Lu FT, Tong XH, Liu YS, Zhang YW, Xu B: Identification of microRNAs that Regulate the MAPK Pathway in Human Cumulus Cells from PCOS Women with Insulin Resistance. Reprod Sci 2020;27:833-844.
https://doi.org/10.1007/s43032-019-00086-5 |
| 52 |
Kobayashi M, Yoshino O, Nakashima A, Ito M, Nishio K, Ono Y, Kusabiraki T, Kunitomi C, Takahashi N, Harada M, Hattori K, Orisaka M, Osuga Y, Saito S: Inhibition of autophagy in theca cells induces CYP17A1 and PAI-1 expression via ROS/p38 and JNK signalling during the development of polycystic ovary syndrome. Mol Cell Endocrinol 2020;508:110792.
https://doi.org/10.1016/j.mce.2020.110792 |