Sphingosine-1-Phosphate Shapes Healthy Monocytes into An Immunosuppressive Phenotype
Keywords
Abstract
Background/Aims:
The physiological phenotype of individuals can influence and shape real-life phenomena in that it can contribute to the development of specific characteristics that can affect the immune response to specific stimuli. In this study we aimed to understand whether the sphingosine/sphingosine-1-phoshate (S1P) axis can modulate the immunotype of circulating cells.Methods:
To pursue this goal, we performed bioinformatic analyses of public datasets.Results:
The transcriptomic profile of healthy subjects of GSE192829 dataset identified two clusters with different transcriptional repertoire. Cluster 1 expressed higher levels of enzymes for S1P formation than cluster 0 which was characterized by enzymes that lead to ceramide formation, which represent the opposite metabolic direction. Inference analysis showed that cluster 1 was higher populated by monocytes, CD4+ T and B cells than cluster 0. Of particular interest was the phenotype of the monocytes in cluster 1 which showed an immunosuppressive nature compared to those in cluster 0. The role of S1P signature in healthy PBMCs was confirmed with other dataset analyses, supporting that circulating monocytes positive to the ceramidase, unlike the negative ones, had an immunosuppressive phenotype characterized by hub immunosuppressive markers (i.e. TYROBP, FCER1G, SYK, SIRPA, CSF1R, AIF1, FCGR2A, CLEC7A, LYN, PLCG2, LILRs, HCK, GAB2). This hub genes well discriminated the immunotype of healthy subjects.Conclusion:
In conclusion this study highlights that S1P-associated hub markers can be useful to discriminate subjects with pronounced immunosuppression.Introduction
The physiological phenotype of individuals is widely described according to the variation of intrinsic (e.g. age, sex), extrinsic (e.g. environment, diet), and genetic factors [1]. Because this aspect can influence and shape the physiological homeostasis and then the response of each individual to the real-life phenomena, the goal of this study was to understand whether the biological axis of sphingosine/sphingosine-1-phosphate (S1P) could affect the immune system activity.
Sphingolipids are components of the cellular membranes and can behave as second messengers to regulate cell homeostasis. Their synthesis or degradation is related to endogenous and exogenous environmental stimuli that can direct immune responses [2]. The balance among different sphingolipids, such as sphingomyelin, ceramide, sphingosine, S1P, toward one sphingolipid or the other can alter the phenotype of either circulating [3] or structural immunocompetent cells [4-5]. In our previous studies, we proved that the activation of Toll-like receptor 9 (TLR9) increased the pro-inflammatory cytokines release via the induction of a ceramide/S1P imbalance in favor of S1P that, in the context of the lung tumor microenvironment, fostered tumor proliferation [4]. The activation of cell surface receptors and the nuclear S1P receptor 3/sphingosine kinase II (S1PR3/SPHK II) axis facilitated tumor cell proliferation [5], highlighting S1P as a pro-tumor driver due to the pro-inflammatory signature. In addition, circulating S1P exacerbated the pro-inflammatory milieu inducing the release of both TNF-α and IL-6 in a S1PR3-dependent manner [3], leading to suppose that S1P can orchestrate circulating immune cells toward a specific phenotype as well as toward an inflammatory profile that could influence the biological homeostasis. Therefore, this study has been designed to understand the variation of the human immune system activity and outline whether S1P-related enzymes/proteins could affect the physiological status of circulating blood cells. To pursue this goal, we evaluated the transcriptomic profile of Peripheral Blood Mononuclear Cells (PBMCs) obtained by healthy subjects taking advantage of public datasets of RNAseq. We identified two clusters of healthy individuals with different transcriptional repertoire; specifically, we characterized a sub-group of healthy individuals with a pronounced metabolism of S1P and an enrichment of immunosuppressive monocytes that could intervene in the establishment of specific immune reactions.
Materials and Methods
Bulk RNAseq database
Public bulk RNAseq data derived by GSE192829 dataset (https://www.ncbi.nlm.nih.gov/geo/query/acc.cgi?acc=GSE192829), was obtained by transcriptomic analysis of PBMCs of 11 healthy subjects, comprising n=3 males and n=8 females. Subjects did not have any pathology or hematological alteration, and they had never smoked. The age of the enrolled subjects was of 44.5±10.2 (mean±standard deviation) [6]. Supplementary Table 1 reports healthy subjects’ characteristics.
Single cell (sc) RNAseq database
The public scRNAseq dataset GSE235857 (https://www.ncbi.nlm.nih.gov/geo/query/acc.cgi?acc=GSE235857) was analyzed. It comprises data from PBMCs obtained from 6 healthy subjects, comprising n=3 males and n=3 females. The age of the enrolled subjects was of 26-37 years old [7].
Python analysis
The analysis of bulk RNAseq data (GSE192829) was performed using Python programming language (version 3.11.4) and Scanpy toolkit (version 1.9.5). The dimensionality of the dataset was reduced using Uniform Manifold Approximation and Projection (UMAP) implemented by the “scanpy.tl.umap” function. Leiden algorithm was used for clustering via “scanpy.pp.neighbors” and “scanpy.tl.leiden” function. The applied parameters were as follows: number of neighbours = 50 (n_neighbours=50), number of principal components = 40 (n_pcs=40) and resolution = 1 (resolution=1). Statistics and differentiation scores of the differentially expressed transcripts (DETs) in each cluster was performed using the “scanpy.tl.rank_genes_groups” function. A supervised analysis based on S1P-related genes was performed sorting out genes with significant expression scores.
The analysis of scRNAseq data (GSE235857) was similarly performed using Python programming language (v.3.11.4) and Scanpy toolkit (v.1.9.5). Doublets were removed using the SOLO algorithm implementation from Scvi-tools [8]. Only high-quality cells were selected filtering out cells with over 3500 or less than 200 unique feature genes and with a mitochondrial gene ratio of more than 8%. The outliers were data with less than three cells and with high numbers of counts. Highly variable genes were determined using “scanpy.pp.highly_variable_genes” function with Seurat settings. We computed the Principal Component Analysis (PCA) and UMAP to reduce the dimensionality of dataset employing “scanpy.tl.pca” and “scanpy.tl.umap” functions, respectively. The parameters of the analysis were as follows: n_neighbors=20, n_pcs=10 and resolution=0.5. Subsequently, we computed Wilcoxon rank-sum test-based statistics and differentiation scores of all genes in each cluster using the “scanpy.tl.rank_genes_groups” function.
Monocytes clusters were manually annotated for each sample according to known gene markers and then performed subclustering using lower resolution allowing an appropriate split of cell clusters. The expression of immunosuppressive genes were highlighted using “scanpy.pl.dotplot”.
TIMER 2.0 analysis
To evaluate the immune profile of PBMCs deriving from healthy donors (GSE192829), TIMER webserver (http://timer.cistrome.org, version 2.0) was used. The immune cells analysis was carried through cibersort deconvolution method.
Gene Set Enrichment Analysis (GSEA)
To understand the cell status and immune perturbations between the two clusters of healthy subjects obtained by Python analysis of bulk RNAseq data (GSE192829), a gene set enrichment analysis was performed with GSEA 4.3.2 (https://www.gsea-msigdb.org/gsea/index.jsp), according to ImmuneSigDB gene sets containing 4872 gene sets, part of C7 immunologic signature gene set database (c7.all.v2023.1.Hs.symbols.gmt), part of Molecular Signatures Database (MSigDB). The following parameters were set: number of permutation: 1000; phenotype labels: cluster 1 vs cluster 0; collapse/remap to gene symbol: collapse; permutation type: gene set; chip platform: Human_Gene_Symbol_with_Remapping_MSignDB.v2023.1.Hs.chip; enrichment statistic: weighted; metric for ranking gene: Signal2Noise; gene list sorting mode: real; gene list ordering mode: descending; max size: 500; min size: 15. The normalized enrichment score (NES) was applied to account for differences in gene set size and in correlation between gene sets and the expression dataset. GSEA determines NES as follow: NES=actual ES/mean (ESs against all permutations of the dataset).
STRING analysis
To characterize the enriched monocytes derived by the PBMCs belonging to cluster 1 compared to cluster 0, a functional enrichment analysis was performed on 435 transcripts obtained by GSEA analysis (Supplementary Table 2), using the STRING database (https://string-db.org; version 12.0 since July 26, 2023). For STRING analysis, the following setting were used: high confidence 0.7; max number of interactions was set at 20 interactors; for the Markov Cluster (MCL) clustering, the inflation parameter was 1.8.
Statistical analysis
Data are reported as median and represented as scatter dot plots. Statistical differences were assessed with two-tailed Mann–Whitney U test. p values less than 0.05 were considered significant. The statistical analysis was performed by using GraphPad prism 10.1.0 version (San Diego, CA, USA).
Results
The transcriptional profiling of healthy PBMCs identifies two clusters characterized by a differential S1P signature
The analysis of bulk RNAseq of GSE192829 identified two clusters (Fig. 1A, blue dots vs orange dots). Cluster 0 (Fig. 1A, blue dots) included 6 out of 11 (54.4%) samples, of which 3 were obtained from males (DK20193B_01, _02, _09; Fig. 1B, light blue rectangles) and 3 from females (DK20193B_03, _05, _11; Fig. 1B, light pink rectangles). Cluster 1 (Fig. 1A, orange dots) included 5 females out of 8 (62.5%) which represented 45.6% of all samples (DK20193B_04, _06, _07, _08, _10; Fig. 1B, light pink rectangles).
This analysis reveals that although without any pathological alteration, PBMCs from healthy donors can be subclustered, most likely reflecting distinct biological states of individuals, regardless of sex.
To understand the differential profile that characterized the two clusters, the expression score obtained by bioinformatic analysis of the transcripts was evaluated. We found that healthy PBMCs in cluster 1 (Fig. 2A, orange bars) showed an over-expression of transcripts of the enzymes involved in the de novo biosynthetic pathway of S1P (Supplementary Fig. 1), compared to cluster 0 (Fig. 2A, blue bars). Specifically, serine palmitoyl-transferase (SPT) subunits (serine palmitoyl-transferase long chain base subunit 1 and 2, SPTLC1 and SPTLC2, and serine palmitoyl-transferase small subunit A, SPTSSA) and 3-ketodihydrosphingosine reductase (KDSR), enzymes involved in the first two steps of the de novo synthesis of S1P (Supplementary Fig. 1), together with the ceramide synthase 2, 4, 5 and 6 (CERS2, 4, 5 and 6) and dihydroceramide desaturase 1 (DEGS1), key enzymes for ceramide synthesis (Supplementary Fig. 1), were over-transcribed in cluster 1 compared to cluster 0 (Fig. 2A, orange bars vs blue bars). Instead, serine palmitoyl-transferase small subunit B (SPTSSB), ceramide synthase 1 and 3 (CERS1 and 3) were not detected, while only dihydroceramide desaturase 2 (DEGS2) was over-transcribed in cluster 0 and not in cluster 1 (Fig. 2A).
To note, ceramide, the sphingosine precursor, can also derive from the hydrolysis of sphingomyelin (Supplementary Fig. 1), mediated by acid (sphingomyelin phosphodiesterase 1, SMPD1) and neutral (sphingomyelin phosphodiesterase 2, 3 and 4, SMPD2, 3 and 4) sphingomyelinase. All 4 isoforms of the enzyme SMPD were over-transcribed in cluster 1 compared to cluster 0 (Fig. 2B, orange bars vs blue bars).
The synthesis of the ceramide is driven towards sphingosine via the activation of the acid (N-acylsphingosine amidohydrolase 1, ASAH1), neutral (N-acylsphingosine amidohydrolase 2, ASAH2) or alkaline (alkaline ceramidase 1, 2 and 3, ACER1, 2 and 3) ceramidase. Once synthesized, sphingosine is then phosphorylated into S1P by sphingosine kinase I and II (SPHK I and II) (Supplementary Fig. 1). We found that ASAH1, ACER2, SPHK I and SPHK II transcripts were over-expressed in cluster 1 compared to cluster 0 (Fig. 2C, orange bars vs blue bars), further confirming the balance towards the sphingosine/S1P pathway in cluster 1. Instead, ASAH2 and ACER1 were not detected, while ACER3 was over-transcribed in cluster 0 (Fig. 2C).
These data imply that both de novo synthesis and sphingomyelin hydrolysis lead towards ceramide production, focal metabolite for the synthesis of sphingosine and then S1P in cluster 1, whereas in PBMCs from cluster 0 these two biosynthetic pathways were blocked. In support, S1P inactivating enzymes (Supplementary Fig. 1) sphingosine-1-phosphate phosphatases 1 (SGPP1) and sphingosine-1-phosphate lyase (SGPL1) were over-expressed in cluster 0 compared to cluster 1 (Fig. 2D, blue bars vs orange bars), moving the balance towards the ceramide synthase, opposite to sphingosine phosphorylation. SGPP2 was not detected in both clusters.
To confirm the involvement of S1P signaling pathway in cluster 1 rather than in cluster 0, the expression of S1P receptors (S1PRs) was evaluated. PBMCs belonging to cluster 1 showed an over-transcription of S1PR1, S1PR2, S1PR3 and S1PR4 (Fig. 2E, orange bars vs blue bars), but not in cluster 0. S1PR5 prevailed in cluster 0 (Fig. 2E).
Taken together these data highlight that healthy subjects can have a heterogenous state of circulating blood cells, clustered in differential subpopulation according to S1P metabolism/synthesis and signaling.
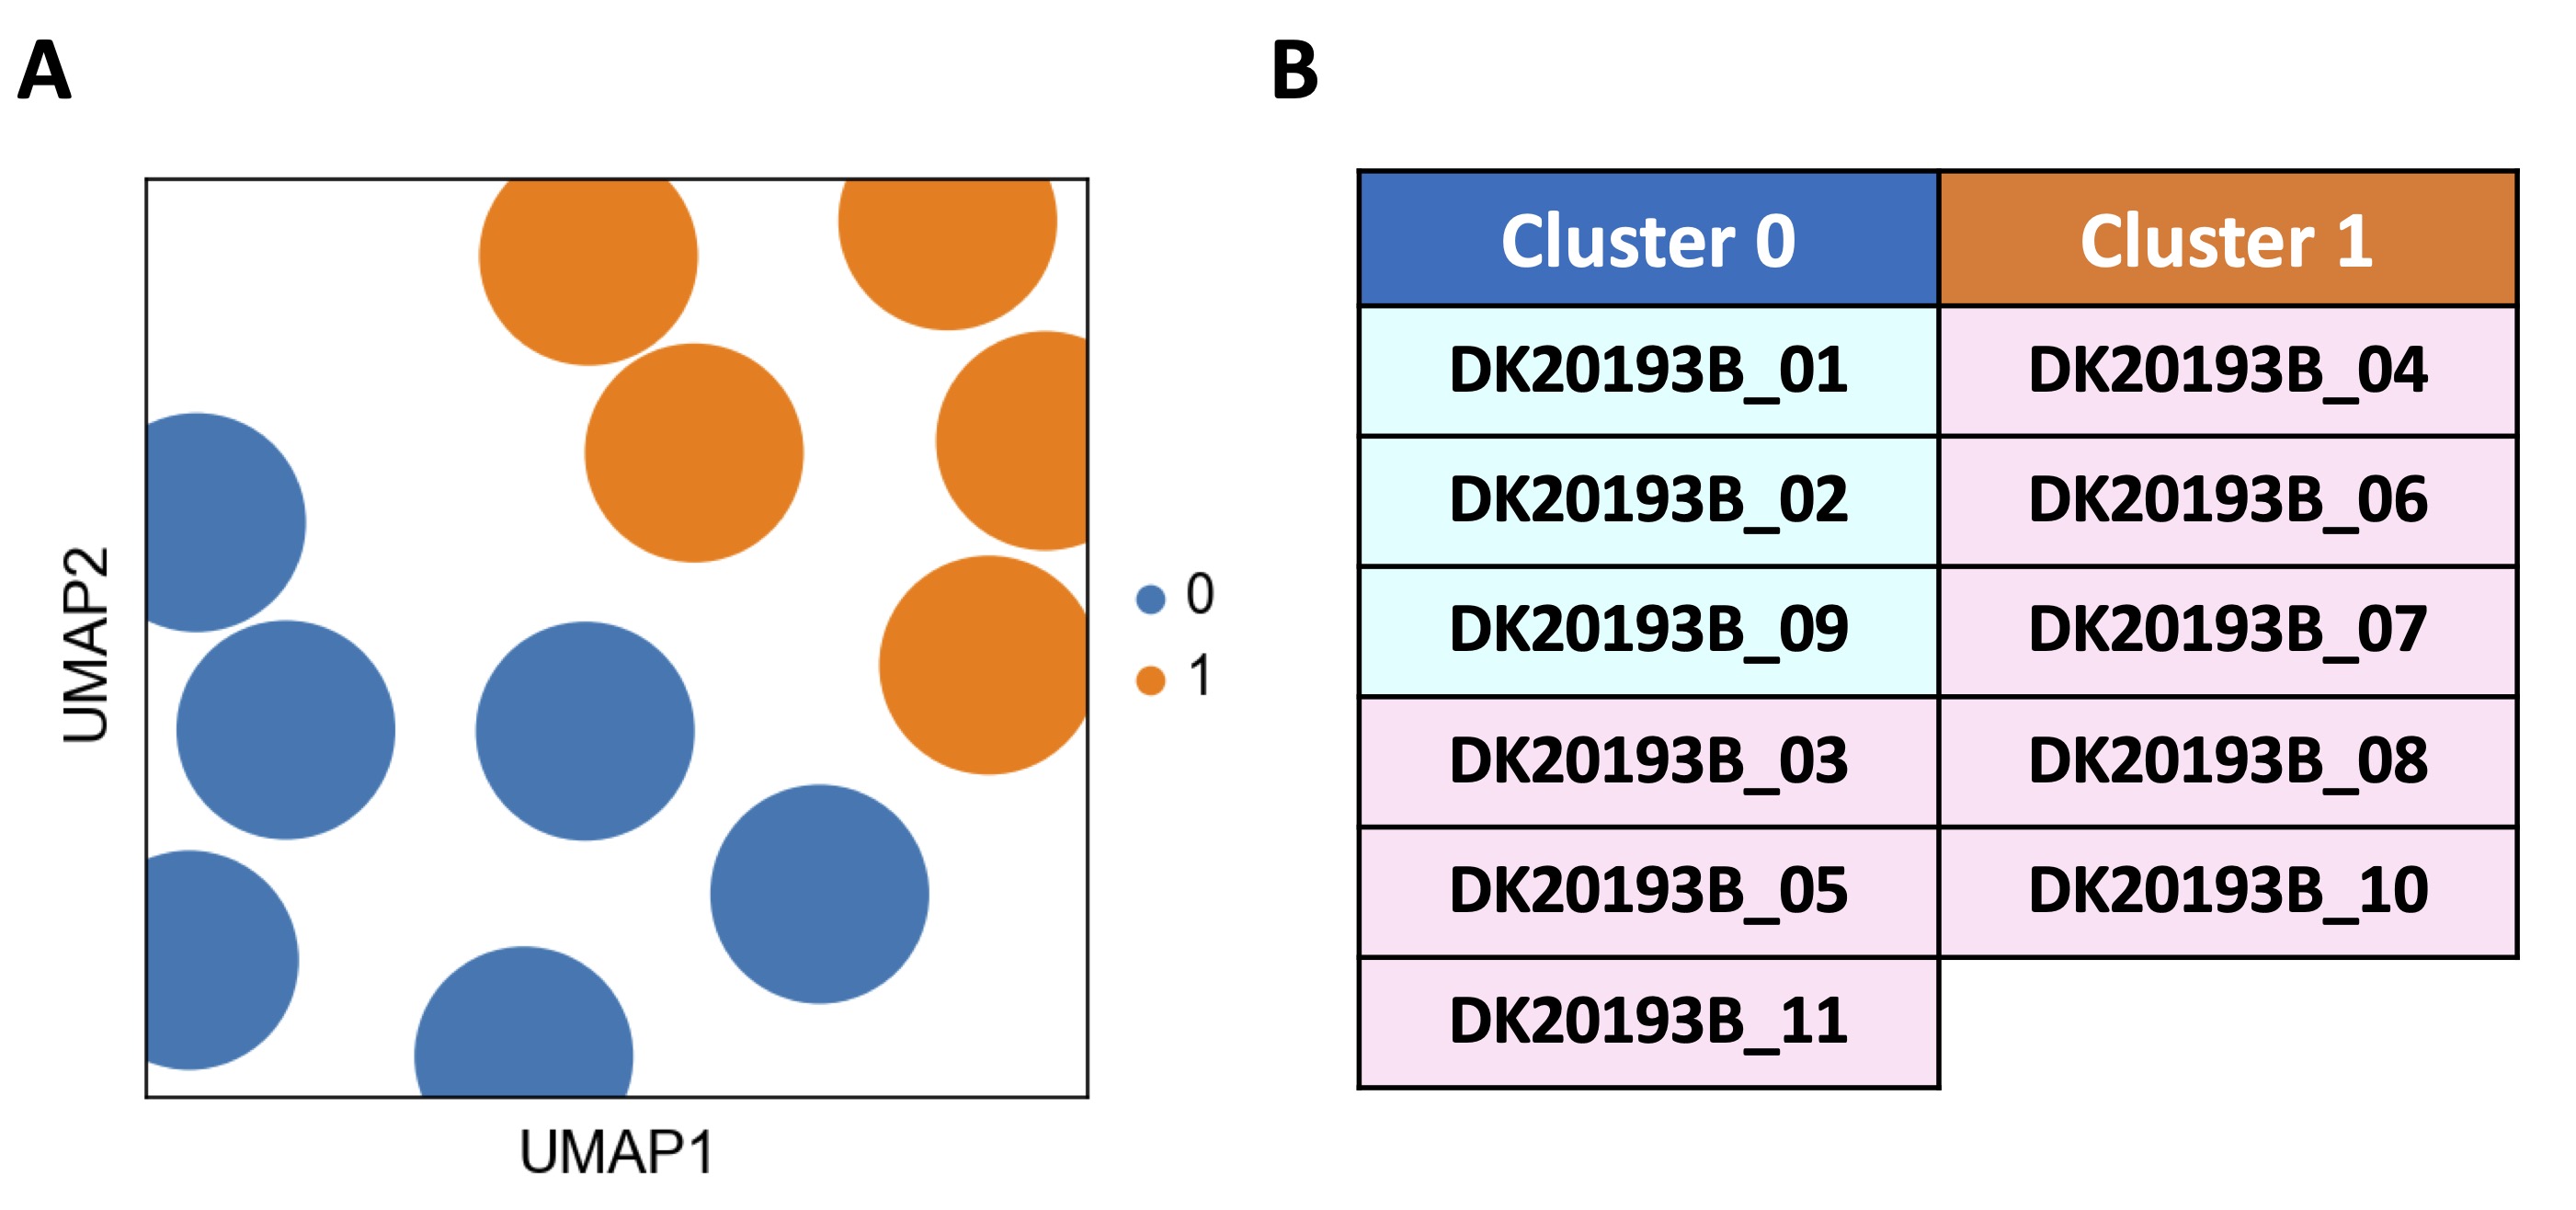
Fig. 1: Transcription profile analysis of healthy subjects-derived peripheral blood mononuclear cells (PBMCs). The transcriptional profile analysis of 11 healthy donors including n=3 males (DK20193B_01, _02, _09) and n=8 females (DK20193B_03, _04, _05, _06, _07, _08, _10, _11) deriving from public database GSE192829 was carried through Python programming language (v.3.11.4) and Scanpy toolkit (v.1.9.5). A) The Uniform Manifold Approximation and projection (UMAP) revealed the distinction of two clusters, cluster 0 (0, blue dots) and cluster 1 (1, orange dots), on the basis of a different transcriptional repertoire. B) Cluster 0 included 6 out of 11 samples, of which 3 males (DK20193B_01, _02, _09; light blue rectangles) and 3 females (DK20193B_03, _05, _11; light pink rectangles), while cluster 1 included 5 out of 11 samples, all females (DK20193B_04, _06, _07, _08, _10; light pink rectangles). Leiden algorithm-based clustering method via scanpy.pp.neighbors and scanpy.tl.leiden functions was applied with the following parameters: number of neighbors = 50, number of principal components = 40 and resolution = 1.
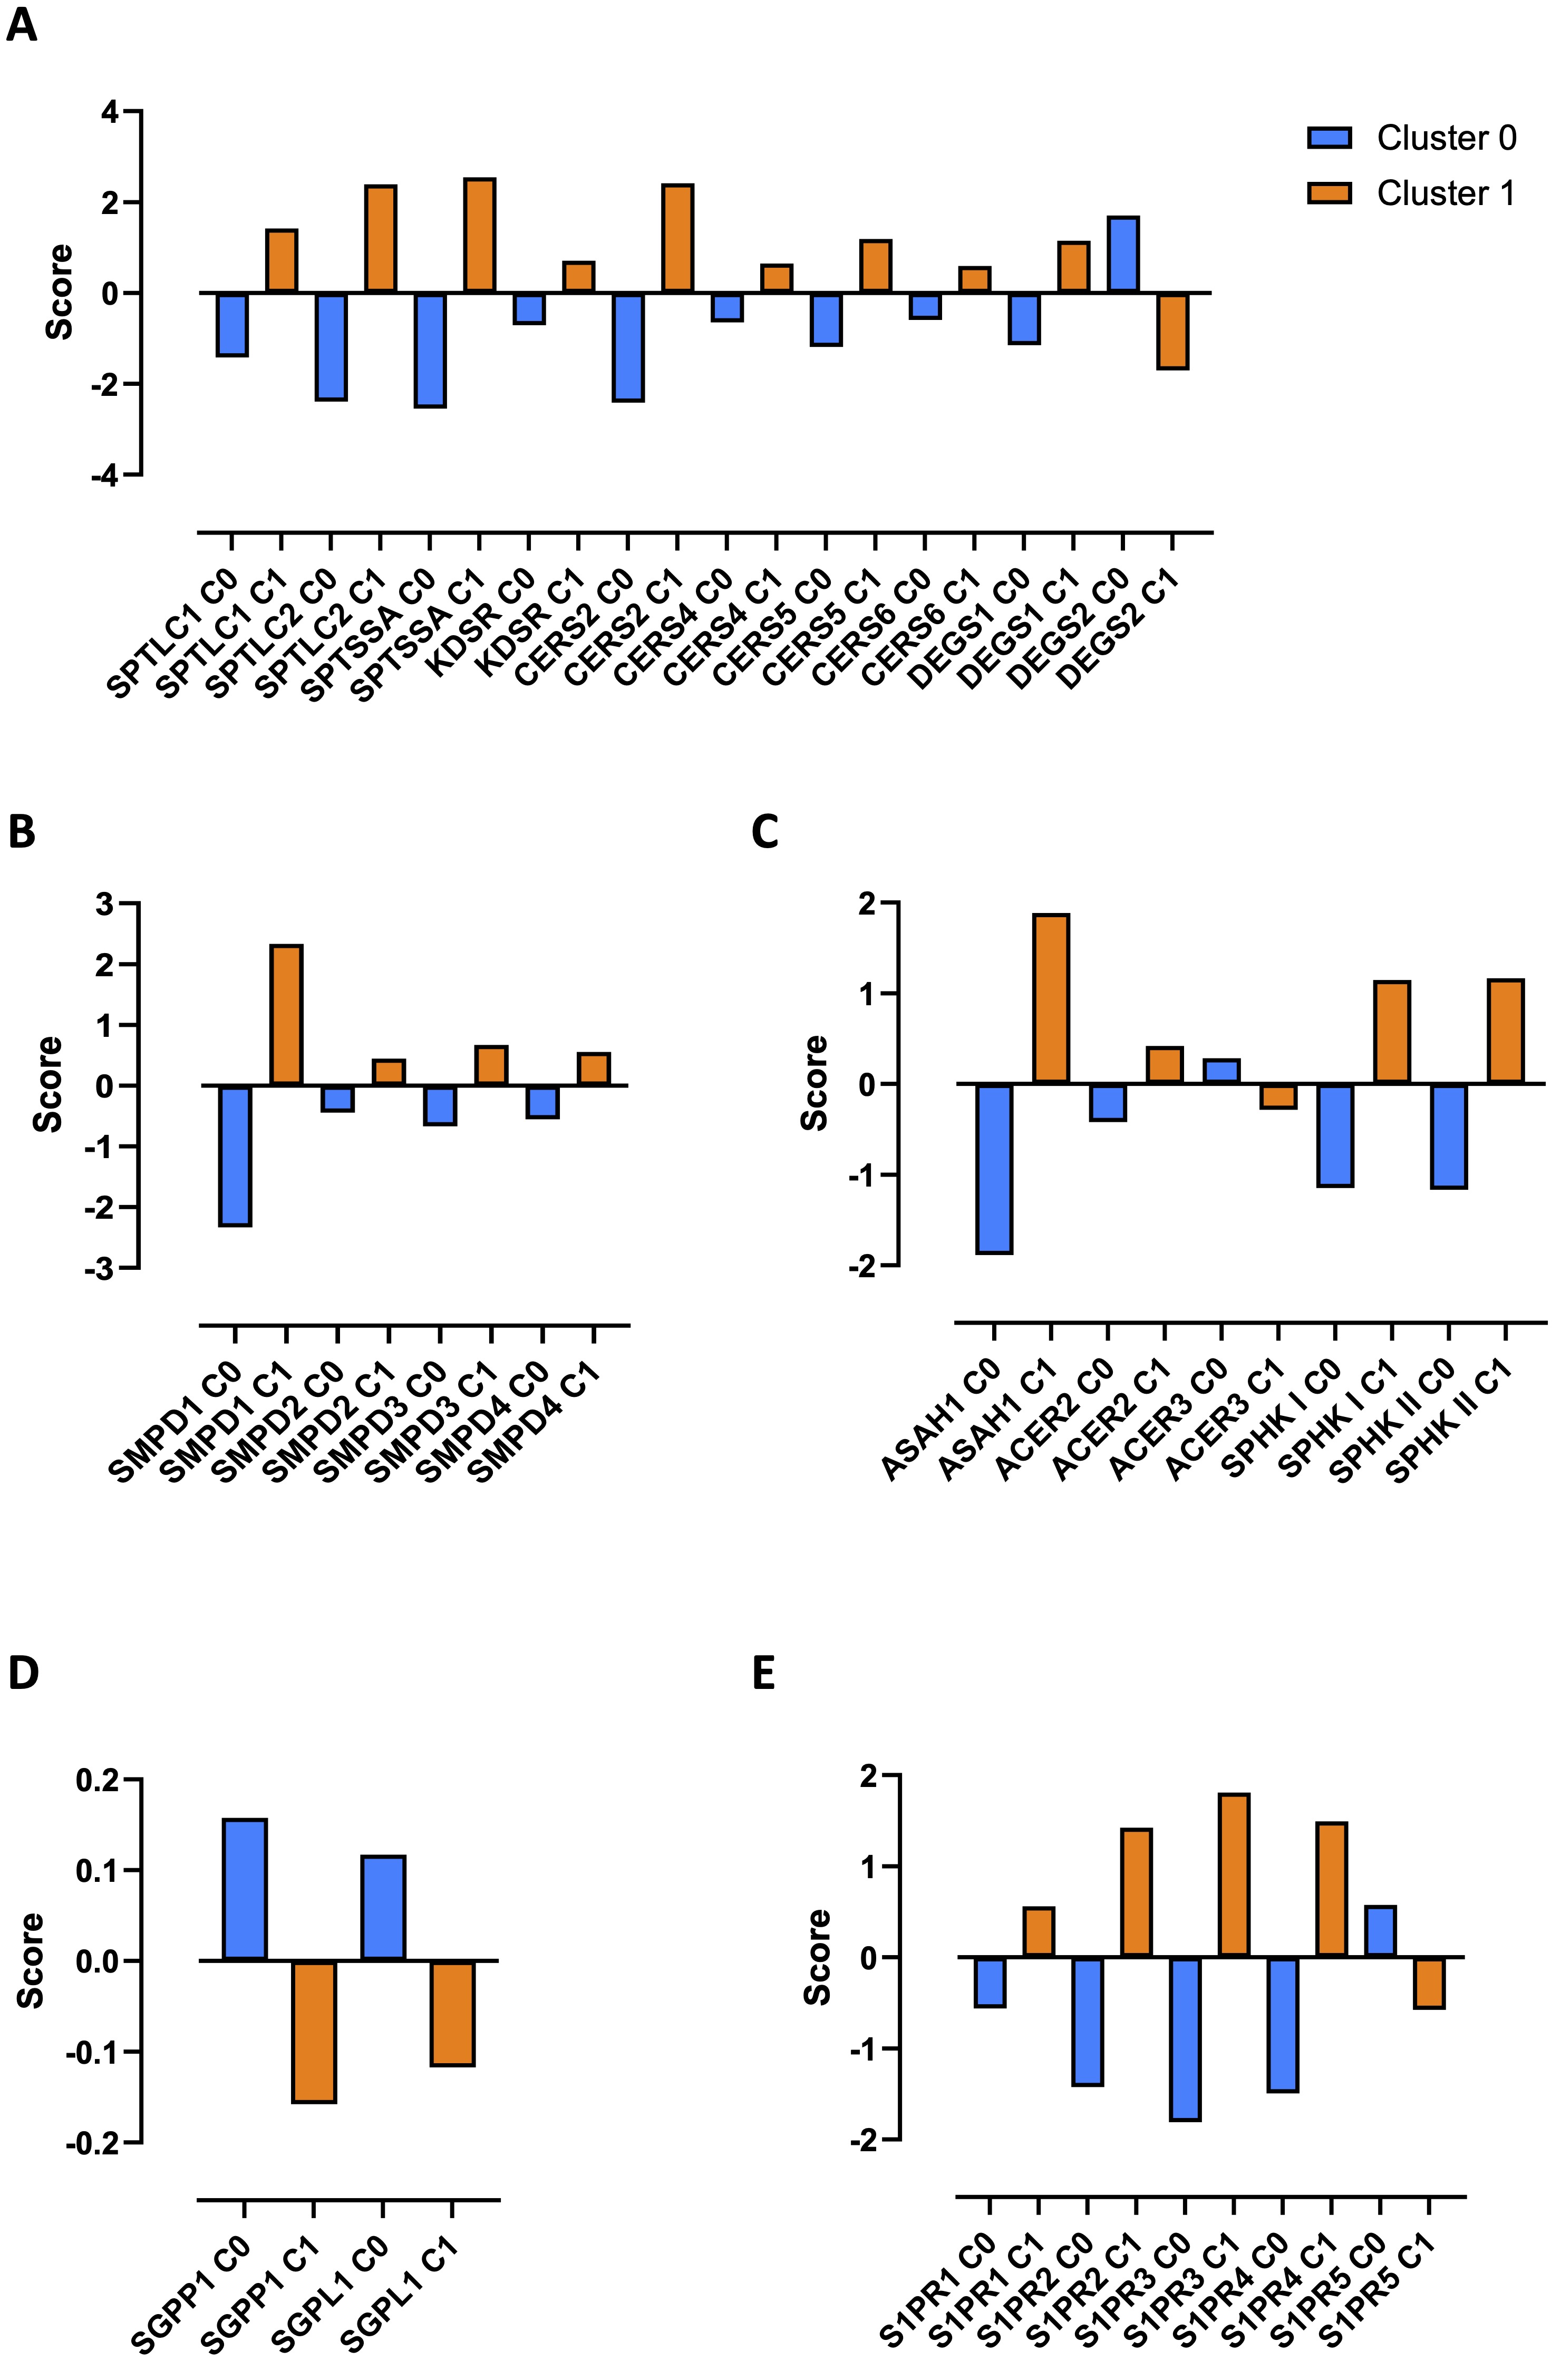
Fig. 2: Sphingosine-1-phosphate (S1P) metabolic signature analysis in healthy donors-derived PBMCs clusters. The differential transcriptional profile of cluster 0 and cluster 1 was evaluated through the expression score of python analysis-derived transcripts. The enzymes involved in the de novo biosynthetic pathway of sphingosine-1-phosphate (S1P) (A) and in the sphingomyelin hydrolysis (B), the ceramidases and sphingosine kinases (C), S1P inactivating enzymes (D) and S1P receptors (S1PRs) (E) are shown. The differentiation scores of the differentially expressed transcripts (DETs) in each cluster was calculated using the "scanpy.tl.rank_genes_groups" function. Serine palmitoyl-transferase long chain base subunit 1 and 2 (SPTLC1 and SPTLC); serine palmitoyl-transferase small subunit A (SPTSSA); 3-ketodihydrosphingosine reductase (KDSR); ceramide synthase 2, 4, 5 and 6 (CERS2, 4, 5 and 6); dihydroceramide desaturase 1 and 2 (DEGS1 and 2); sphingomyelin phosphodiesterase 1, 2, 3 and 4 (SMPD1, 2, 3 and 4); acylsphingosine amidohydrolase 1 (ASAH1); N-acylsphingosine amidohydrolase 2 (ASAH2); alkaline ceramidase 2 and 3 (ACER2 and 3); sphingosine kinase I and II (SPHK I and II); sphingosine-1-phosphate phosphatases 1 (SGPP1); sphingosine-1-phosphate lyase (SGPL1); sphingosine-1-phosphate receptor 1, 2, 3, 4 and 5 (S1PR1, 2, 3, 4 and 5).
S1P positive cell cluster associates with circulating CD4 + T cells and monocytes
PBMCs comprise circulating mononuclear cells, including monocytes, T cells, B cells, dendritic cells (DCs) and natural killer (NK) cells. To evaluate the immune profile of the two clusters that we highlighted, TIMER 2.0 webserver was used. The deconvolution performed using the cibersort method, revealed that CD4+ T cells and monocytes were the most represented cells of both cluster 0 and 1 (Fig. 3A, blue and yellow slices respectively), along with a smaller percentage of CD8+ T cells, B cells, NK cells, myeloid DCs (mDCs), macrophages and neutrophils (Fig. 3A, red, pink, brown, orange, green and violet slices respectively). In particular, CD4+ naïve T cells were significantly more present in cluster 1 compared to cluster 0 (Fig. 3B), while there were no differences in CD4+ memory resting T cells (Fig. 3C) and CD8+ T cells (Fig. 3D) between the two clusters. CD4+ memory activated T cells, regulatory T cells (Treg), T helper and gamma delta T cells were not detected. PBMCs belonging to cluster 1 showed a significant increase of memory B cells (Fig. 3E) and monocytes (Fig. 3F), while naïve B cells, plasma cells, macrophages M0, M1 and M2 were not detected in both clusters. Activated mast cells were significantly increased in cluster 1 (Fig. 3G), although they were less present than the other immune cells. Resting mast cells, eosinophils and neutrophils were not detected. No differences emerged between the two clusters in activated NK (Fig. 3H), resting NK (Fig. 3I) and activated mDCs (Fig. 3J).
The immune profile analysis revealed that cluster 1 was especially enriched of CD4+ naïve T cells and monocytes compared to cluster 0.
To understand the immune phenotype of the cells represented in the two clusters, a GSEA analysis was performed according to ImmuneSigDB gene sets, part of C7 immunologic signature gene set database (c7.all.v2023.1.Hs.symbols.gmt). We found that 4861 out of 4872 gene sets were upregulated in cluster 1 whereas cluster 0 counted only 11 upregulated gene sets out of 4872. The heatmap in Fig. 4A shows the top-50 genes upregulated in cluster 1 (Fig. 4A, grey) compared to cluster 0 (Fig. 4A, yellow). The dataset showed that 47.8% (12275) of genes in cluster 1 with a correlation area of 83.4% was upregulated, whereas cluster 0 was characterized by 52.2% (13387) of genes with a correlation area of 16.6% (Fig. 4B).
The analysis of the enrichment score (NES) of significantly higher expressed genes (FDR<0.25) showed that cluster 1 was especially enriched of monocyte-associated genes, which prevailed over mDCs and plasmacytoid DCs (pDCs) (Fig. 4C). Supplementary Fig. 2A and 2B show the heat maps of 199 genes more representative in each gene sets for each sample.
Taken together these data show that cluster 0 and cluster 1, show a differential role of the sphingosine/S1P pathway that besides the metabolic, can also impact on the immune phenotype.
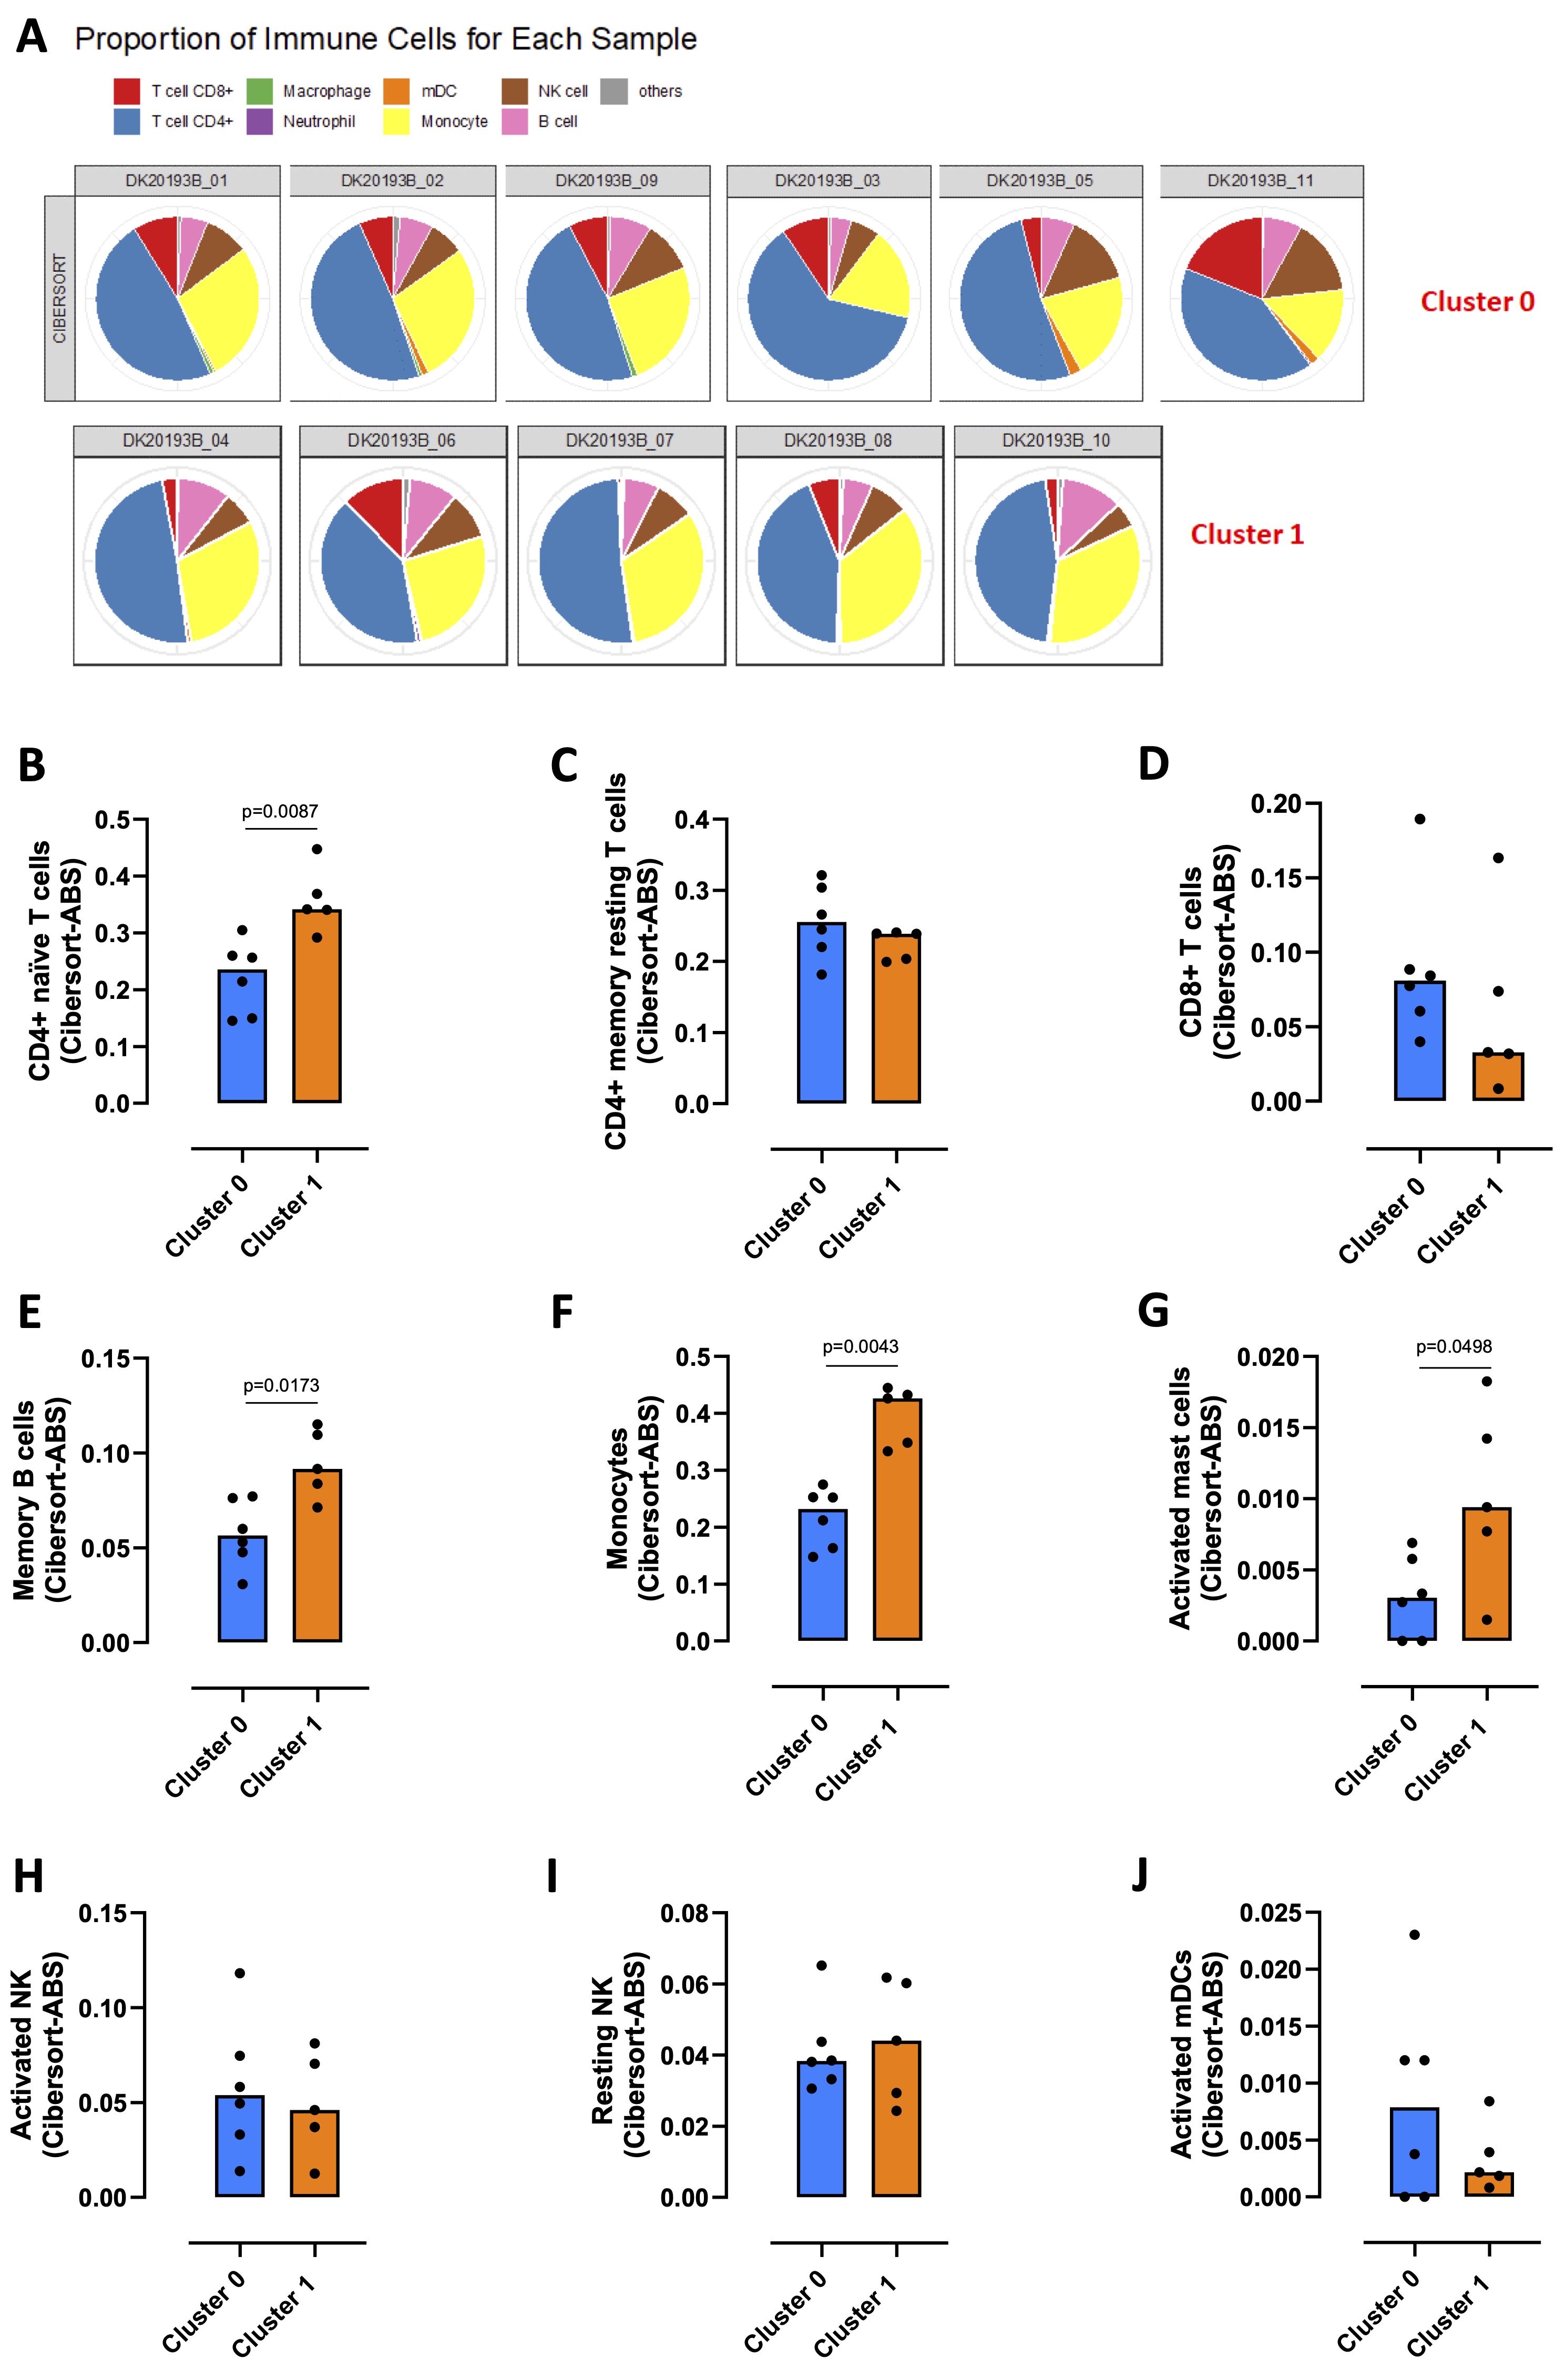
Fig. 3: Immune profile analysis of healthy donors-derived PBMCs clusters. TIMER 2.0 webserver (http://timer.cistrome.org) was used to evaluate the immune profile that characterized cluster 0 and cluster 1 obtained by python analysis. A) Proportion of immune cells in cluster 0 and cluster 1 carried through cibersort deconvolution method. Expression of CD4+ naïve T cells (B), CD4+ memory resting T cells (C), CD8+ T cells (D), memory B cells (E), monocytes (F), activated mast cells (G), activated NK (H), resting NK (I) and activated myeloid dendritic cells (mDCs) (J) in cluster 0 (blue bars) vs cluster 1 (orange bars). Data are reported as median (confidence interval = 95%) and represented as scatter dot plots. Statistical differences were assessed with two-tailed Mann–Whitney U test.
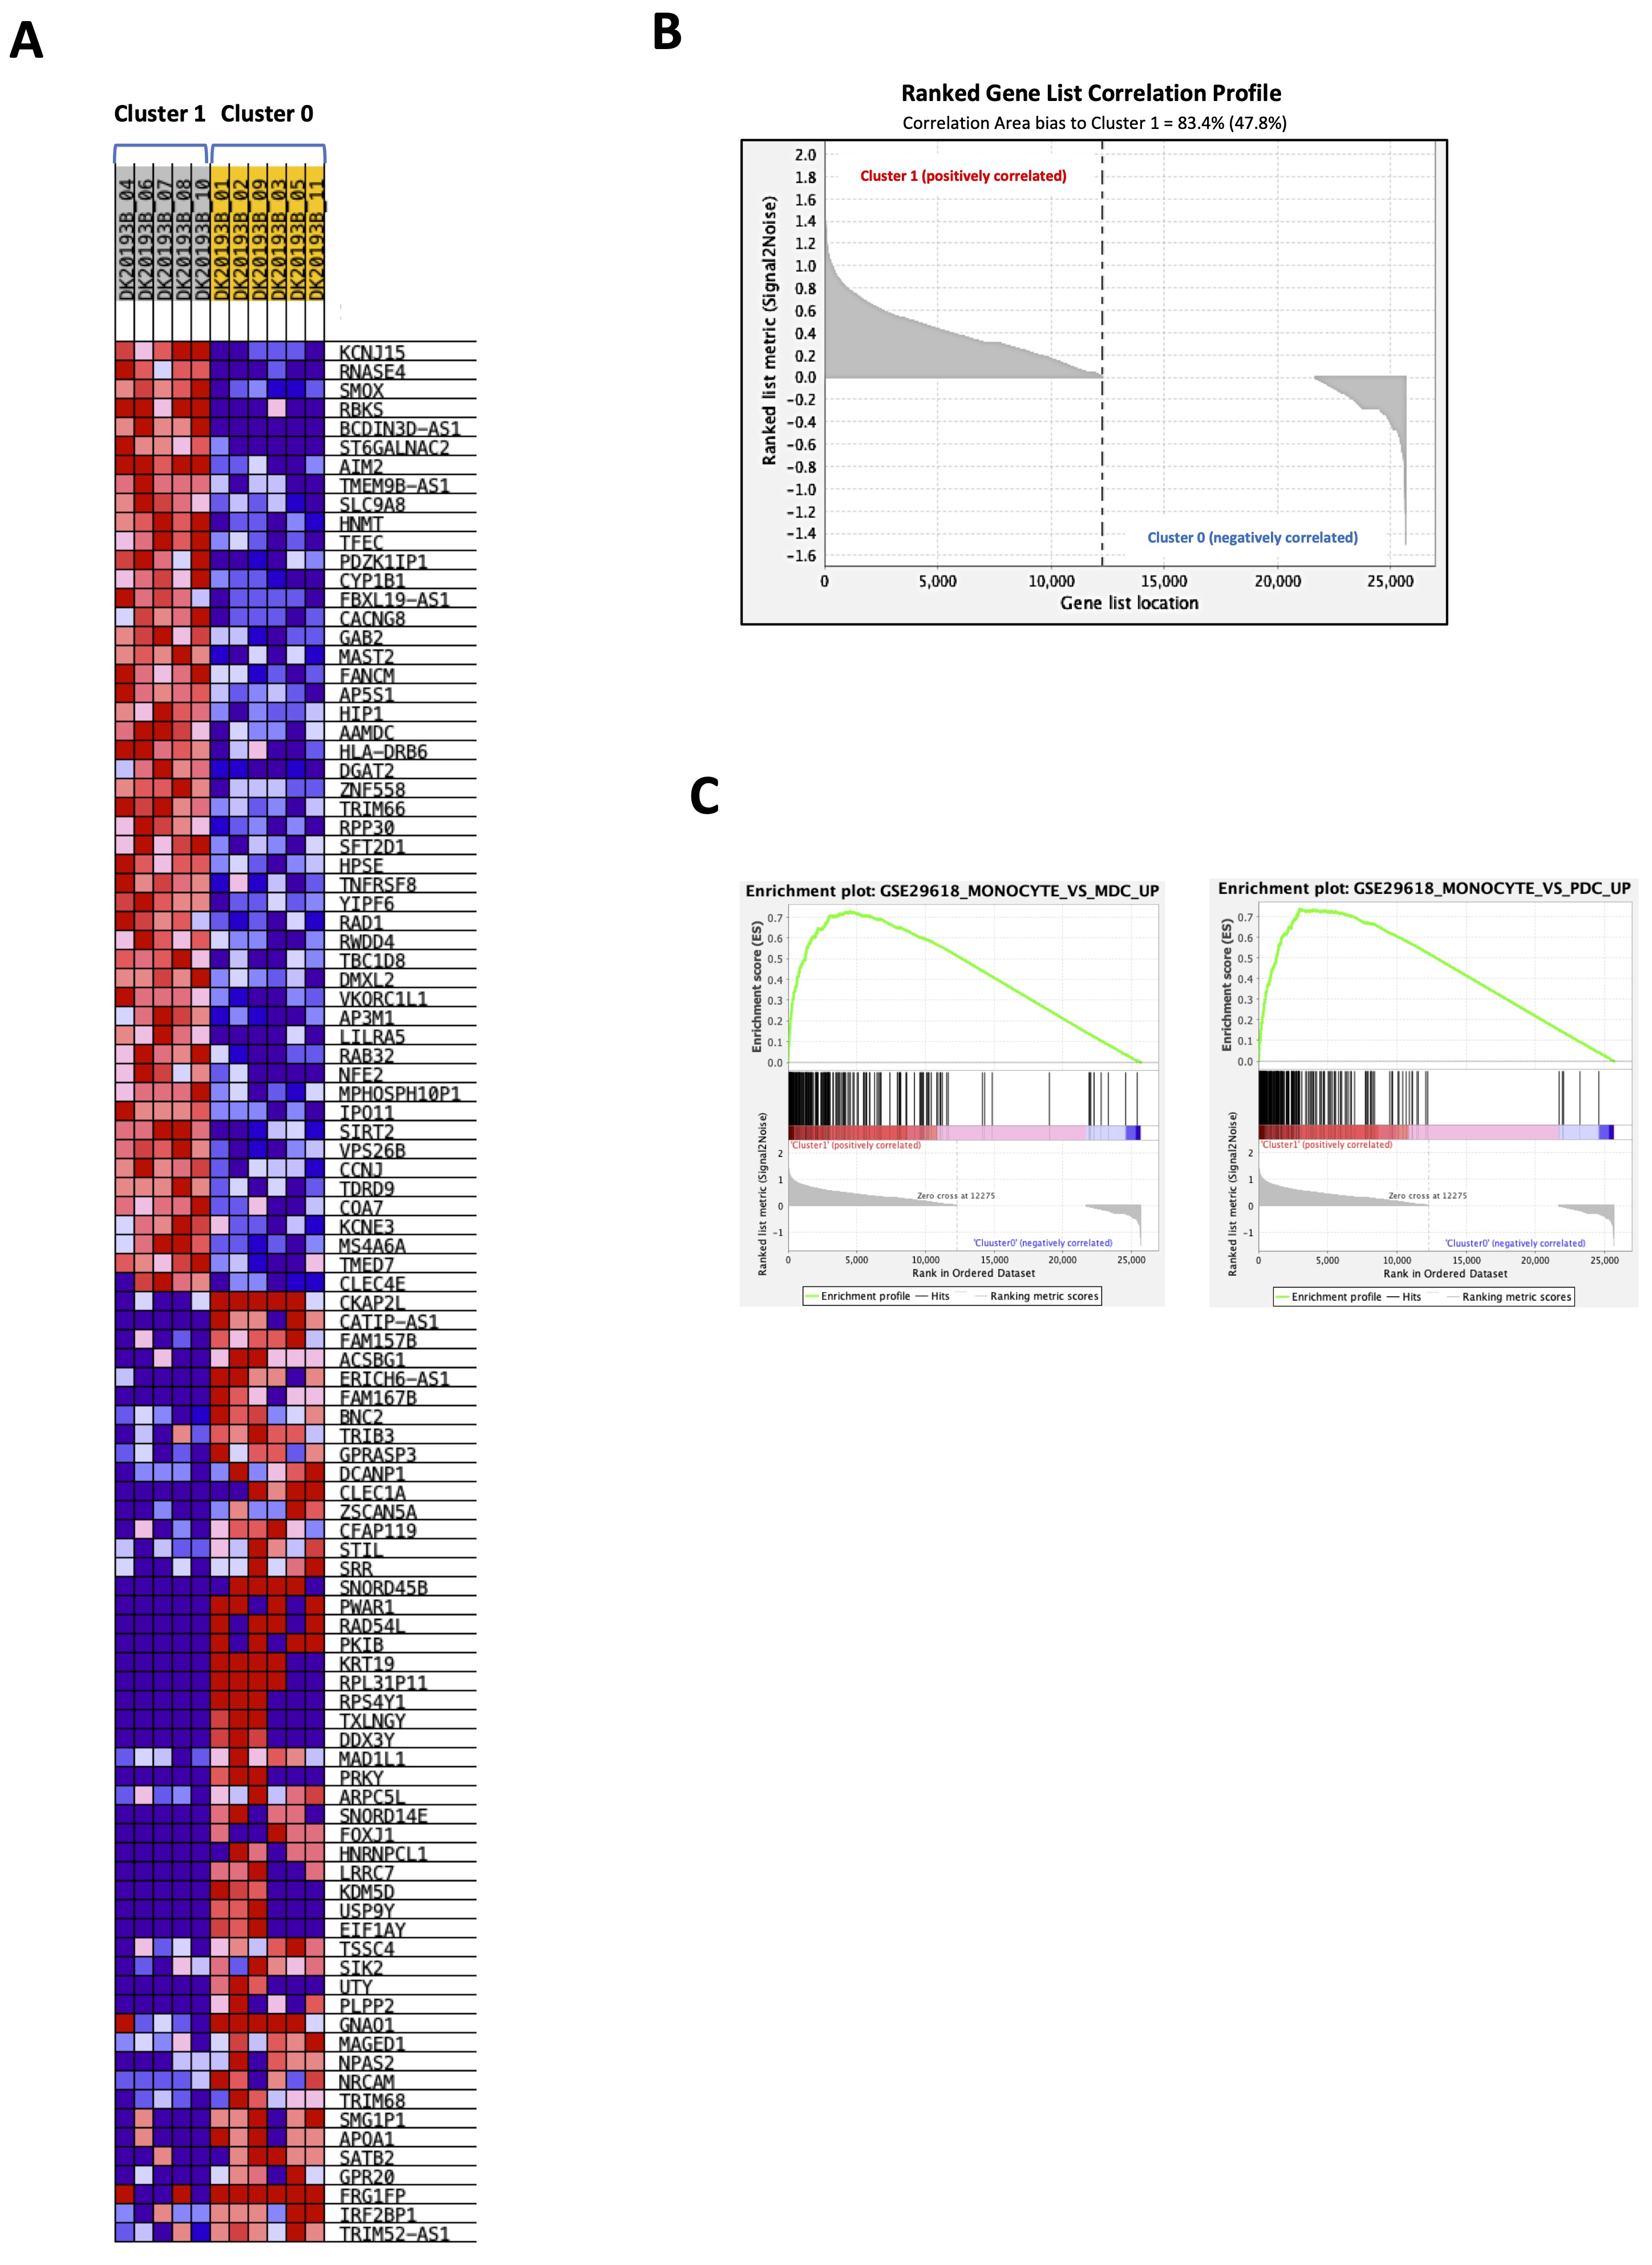
Fig. 4: Gene set enrichment analysis (GSEA) of healthy donors-derived PBMCs cluster 1 vs cluster 0. A gene set enrichment analysis was performed with GSEA 4.3.2 (https://www.gsea-msigdb.org/gsea/index.jsp) according to ImmuneSigDB gene sets, part of C7 immunologic signature gene sets database (c7.all.v2023.1.Hs.symbols.gmt) on 26467 transcripts from cluster 1 vs cluster 0 obtained by python analysis. A) Heatmap showing the top 50 transcripts for up-regulation or down-regulation in each phenotype (cluster 1, grey vs cluster 0, yellow). B) Ranked gene list correlation profile plot showing the positive and negative correlation between the ranked genes and the phenotypes (cluster 1 vs cluster 0). C) Enrichment plots of monocytes vs myeloid dendritic cells (mDCs) and monocytes vs plasmacytoid dendritic cells (pDCs) gene sets in cluster 1 compared to cluster 0.
S1P positive cluster associates with immunosuppressive monocytes.
To characterize the monocytes enriched in cluster 1, which had a higher metabolism of the ceramide in favor of S1P formation, the gene sets resulting from GSEA analysis were subjected to a STRING analysis. 435 transcripts enriched in the monocytes of cluster 1 compared to cluster 0 were highlighted; the duplicates were eliminated (Supplementary Table 2). The MCL algorithm was run, and 57 sub-clusters were identified (Supplementary Fig. 3A and 3B). Sub-cluster 1, the more representative gene set (34 out of 435 transcripts) (Supplementary Fig. 3A and 3B, red bubbles), included 34 targets involved in the immune response regulation (Fig. 5A). Among these, we considered those interacting with a score > 0.9 in order to abolish false positives. In the subcluster 1, 10 genes out of 34 did not have a score > 0.9 (BCL6, FGR, FPR1, LST1, P2RY13, PILRA, ITGAM, LCP2, FYB1, MNDA) (Fig. 5A, grey square). The other two networks of hub genes (Fig. 5A, blue and violet rectangular) were associated with the induction of an immunosuppressive microenvironment. The first network included TYROBP, TREM1, FCER1G, SYK, SIRPA, SPI1, CSF1R and AIF1 (Fig. 5A, PPI-Network 1, blue rectangular and Fig. 5B, blue circle); TYROBP, FCER1G, SYK, SIRPA, CSF1R and AIF1 were statistically increased in cluster 1 compared to cluster 0 (Fig. 6A, C, D, E, G, H, orange bar vs blue bar), while TREM1 and SPI1 were tendentially over-expressed in cluster 1 compared to cluster 0, although not significantly (Fig. 6B, median cluster 0: 7.5 vs median cluster 1: 14; and Fig. 6F, median cluster 0: 68 vs median cluster 1: 86). TYROBP, FCER1G, SYK and SIRPA were in common with the second network, which also included BLNK, FCGR2A, CD79A, CLEC7A, LYN, PLCG2, LAT2, LILRA1-2-5-6, LILRB1-2-3, HCK, GAB2 (Fig. 5A, PPI-Network 2, violet square and Fig. 5B, violet circle). Except for BLNK (Fig. 6I) and LILRA6 (Fig. 6S), the others transcripts were significantly increased in cluster 1 compared to cluster 0 (Fig. 6J, L, M, N, Q, R, T, U, V, W, X); CD79A, LAT2, LILRA1 were tendentially over-expressed in cluster 1 compared to cluster 0, although not significantly (Fig. 6K, median cluster 0: 63 vs median cluster 1: 101; Fig. 6O, median cluster 0: 45.5 vs median cluster 1: 68; Fig. 6P, median cluster 0: 23.5 vs median cluster 1: 35).
The other more representative STRING-derived sub-clusters (Supplementary Fig. 3A and 3B) included genes mostly involved in the regulation of carbohydrate (sub-cluster 2, with 25 out of 435 transcripts; Supplementary Fig. 3A and 3B, light brown bubbles) or neuronal (sub-cluster 3, with 20 out of 435 transcripts; Supplementary Fig. 3A and 3B, brown bubbles) metabolic processes, not correlated to the activation/regulation of immune system. The remaining sub-clusters (from sub-cluster 4 to sub-cluster 57; Supplementary Fig. 3A and 3B) showed no interactions with FDR > 0.9.
Altogether these data show that healthy subjects-derived PBMCs belonging to cluster 1 and characterized by an increased transcription of enzymes for S1P synthesis, are enriched of immunoregulatory genes.
To verify whether an enhanced S1P metabolism/synthesis in monocytes was correlated to their immunosuppressive phenotype, a scRNAseq analysis of 6 healthy donor-derived PBMCs (GSE235857) was performed (Fig. 7A). The monocytes were characterized (Fig. 7A, cluster 4, violet highlighted dots) and sub-clustered (Fig. 7B). The expression of ASAH1, key enzyme for S1P synthesis [3-5], was evaluated in each sub-cluster. First, we found that the monocytes cluster (Fig. 7A, cluster 4, violet highlighted dots), sub-clustered in two different populations in all samples, according to ASAH1 expression (Fig. 7B, ASAH1 positive, orange dots vs ASAH1 negative, blue dots). To characterize the two sub-clusters of monocytes (ASAH1 positive, sub-cluster 0, orange dots in Fig. 7B vs ASAH1 negative, sub-cluster 1, blue dots in Fig. 7B), the expression of 24 hub immunosuppressive targets (TYROBP, TREM1, FCER1G, SYK, SIRPA, SPI1, CSF1R, AIF1, BLNK, FCGR2A, CD79A, CLEC7A, LYN, PLCG2, LAT2, LILRA1-2-5-6, LILRB1-2-3, HCK, GAB2), before identified (Fig. 5B), was evaluated. Surprisingly, ASAH1 positive sub-cluster 0 showed an immunosuppressive phenotype unlike ASAH1 negative sub-cluster 1 (Fig. 8A-X; data shown for 1 representative sample out of 6). Specifically, 3 out of 6 samples over-expressed 23 out of 24 genes of the hub immunosuppressive markers; 2 out of 6 samples over-expressed 22 out of 24 genes of hub immunosuppressive markers, and 1 out of 6 samples over-expressed 15 out of 24 of hub immunosuppressive markers.
These data show that, in physiological conditions, an enhanced S1P metabolism/synthesis in monocytes can shape toward an immunosuppressive phenotype.
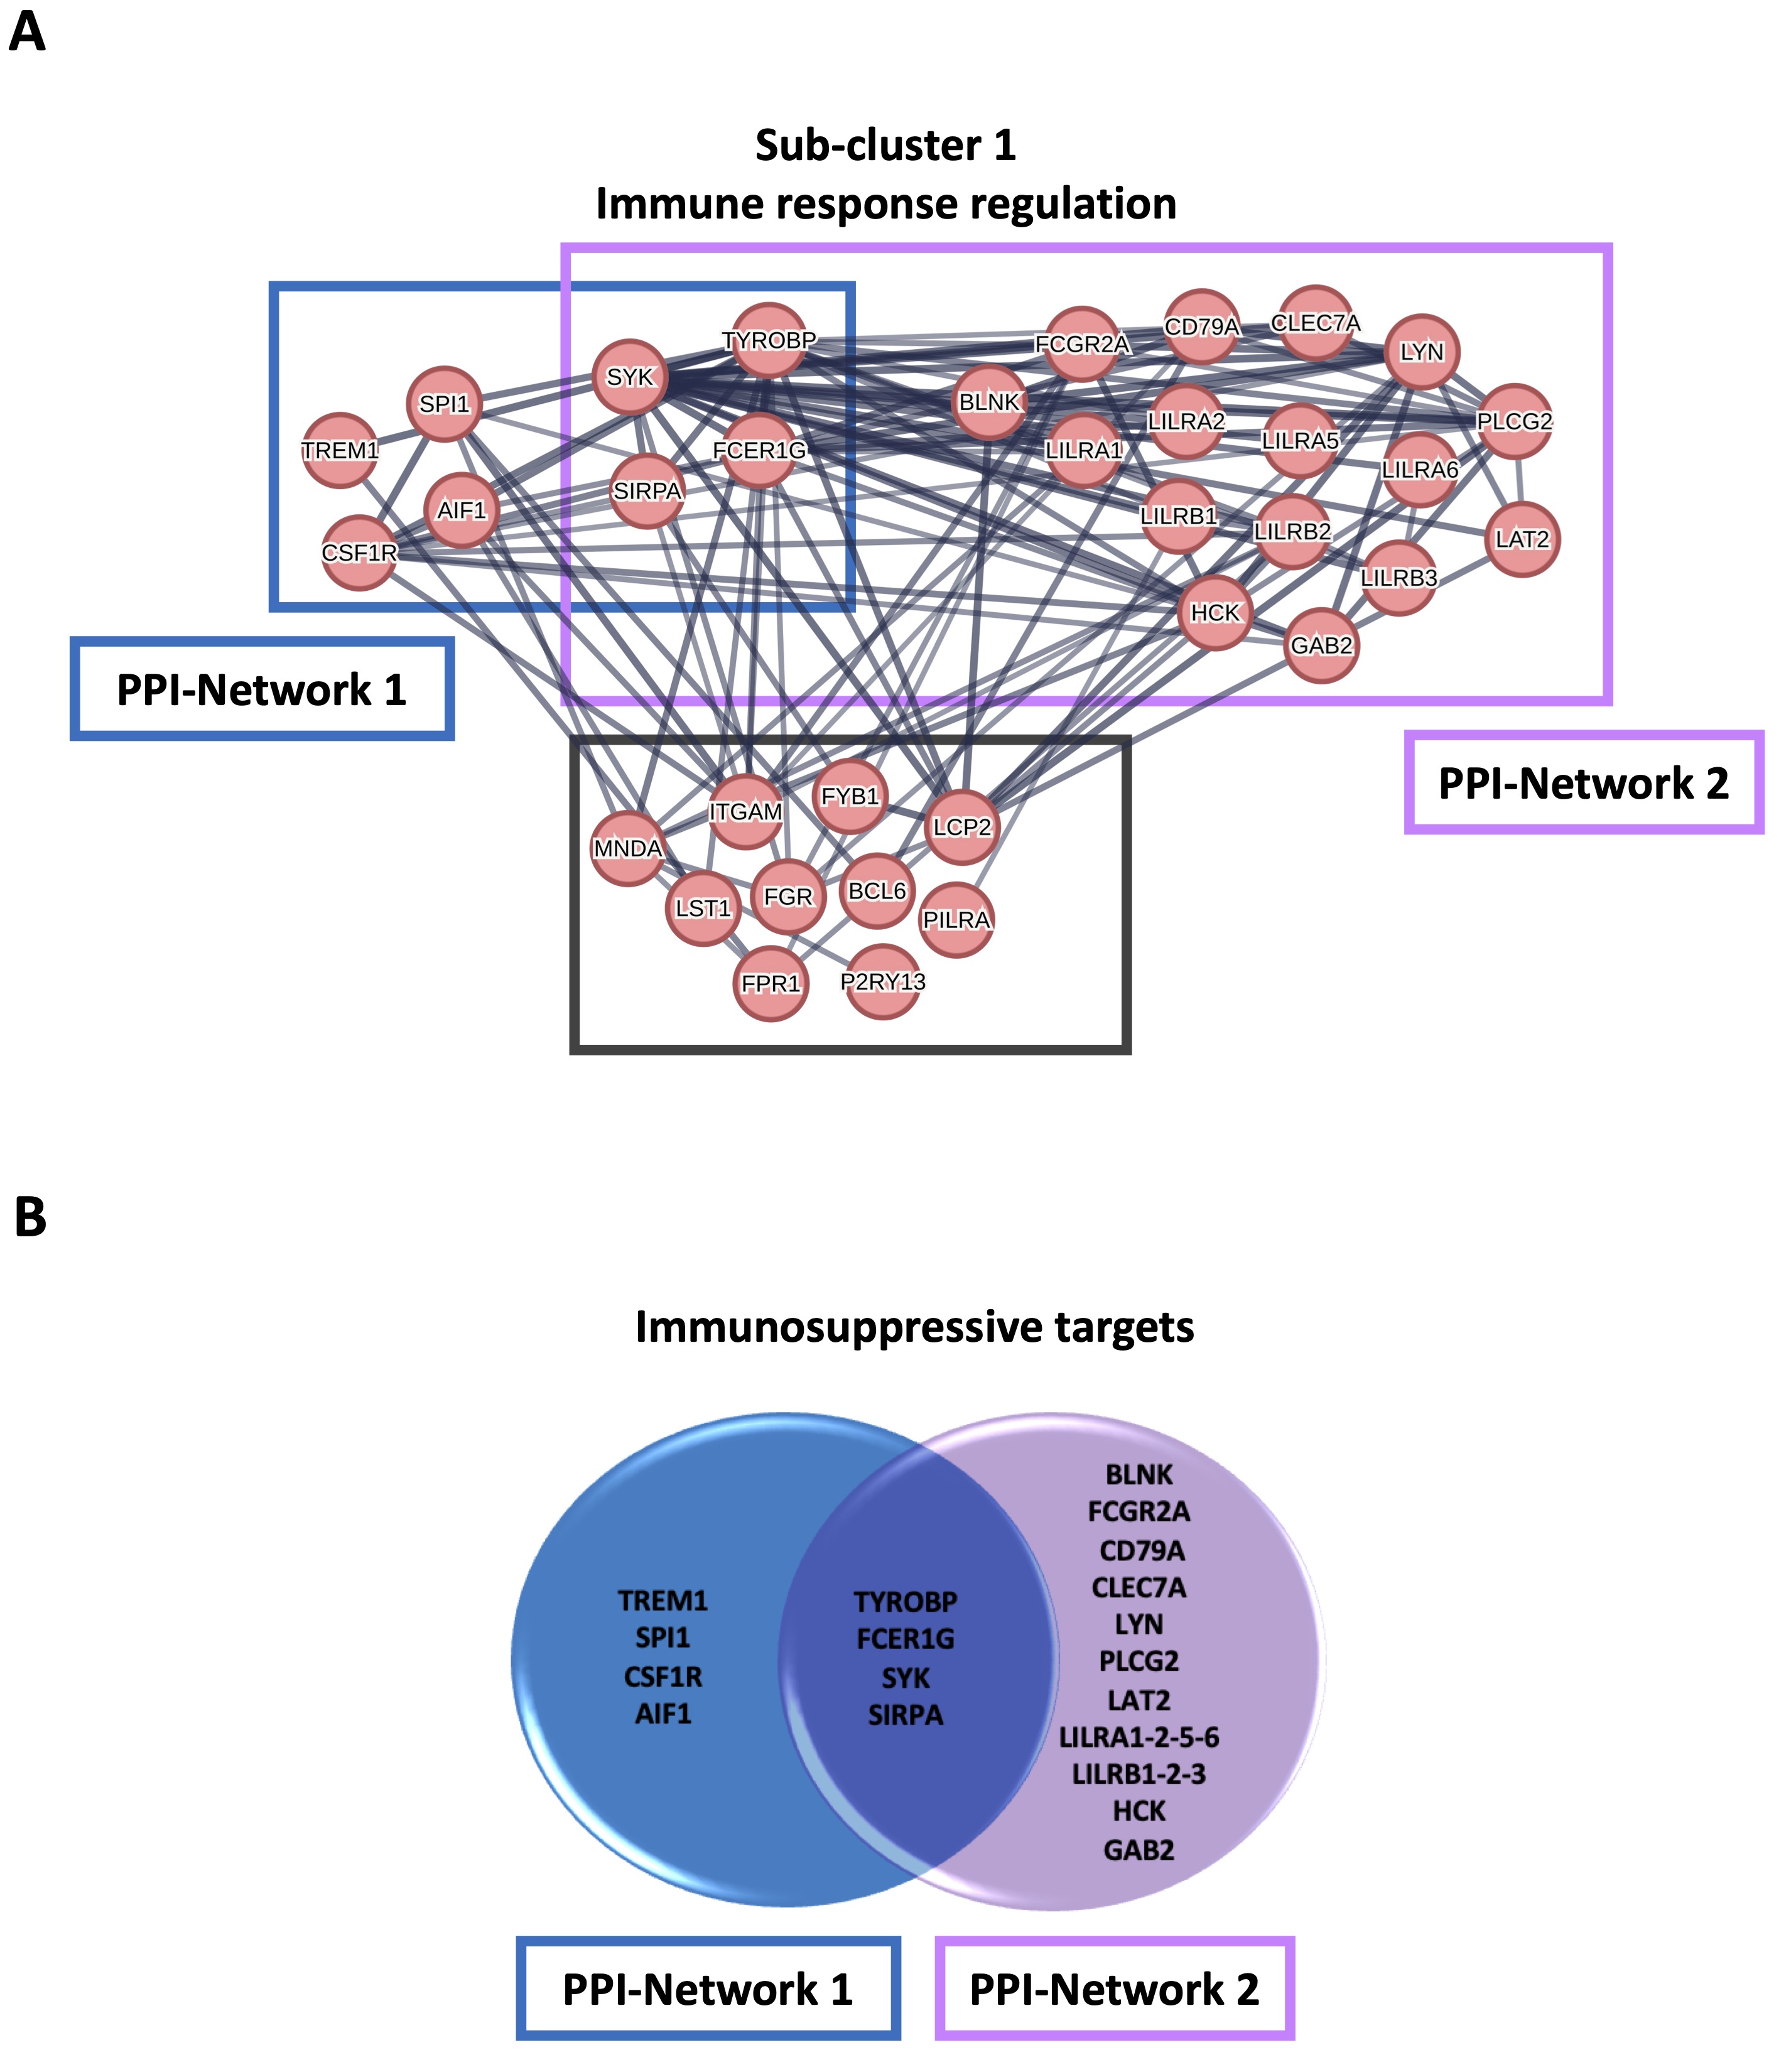
Fig. 5: STRING analysis of healthy donors-derived PBMCs clusters. A STRING analysis was performed on 435 transcripts enriched in the monocytes from cluster 1 compared to cluster 0, and 57 sub-clusters were obtained; only the transcripts with an interacting score > 0.9 were considered. A) The sub-cluster 1 included 34 targets involved in the immune response regulation; 24 out of 34 were immunosuppressive targets, of whom 8 belonging to protein-protein interaction (PPI)-Network 1 (TYRO Protein Tyrosine Kinase-Binding Protein (TYROBP), Triggering receptor expressed on myeloid cells 1 (TREM1), Fc Fragment of IgE Receptor Ig (FCER1G), Spleen tyrosine kinase (SYK), Signal Regulatory Protein Alpha (SIRPA), Spi-1 proto-oncogene (SPI1), colony-stimulating factor-1 receptor (CSF1R), Allogeneic inflammatory factor-1 (AIF1); blue square) and 20 belonging to PPI-Network 2 (TYROBP, FCER1G, SYK, SIRPA, B Cell Linker (BLNK), Fc Gamma Receptor IIa or CD32 (FCGR2A), B-Cell Antigen Receptor Complex-Associated Protein Alpha Chain (CD79A), C-Type Lectin Domain Containing 7A or Dectin-1 (CLEC7A), Lck/Yes-Related Novel Protein Tyrosine Kinase (LYN), Phospholipase C Gamma 2, PLCγ2 (PLCG2), linker for activation of T cells family member 2 (LAT2), leukocyte immunoglobulin-like receptor A 1-2-5-6 (LILRA1-2-5-6), leukocyte immunoglobulin-like receptor B 1-2-3 (LILRB1-2-3), Hemopoietic Cell Kinase (HCK), GRB2 Associated Binding Protein 2 (GAB2); violet square); TYROBP, FCER1G, SYK and SIRPA were in common between the two networks. 10 out of 34 targets did not have a score > 0.9 (B-cell lymphoma 6 protein, BCL6; Tyrosine-Protein Kinase Fgr, FGR; Formyl Peptide Receptor 1, FPR1; Leukocyte Specific Transcript 1, LST1; Purinergic Receptor P2Y13, P2RY13; Paired Immunoglobin Like Type 2 Receptor Alpha, PILRA; Integrin Subunit Alpha M, ITGAM; Lymphocyte Cytosolic Protein 2, LCP2; FYN Binding Protein 1, FYB1; Myeloid Cell Nuclear Differentiation Antigen, MNDA) (grey square). B) Venn diagram of 24 immunosuppressive targets belonging to sub-cluster 1. The functional enrichment analysis was by means of STRING database (https://string-db.org; version 12.0 since July 26, 2023).
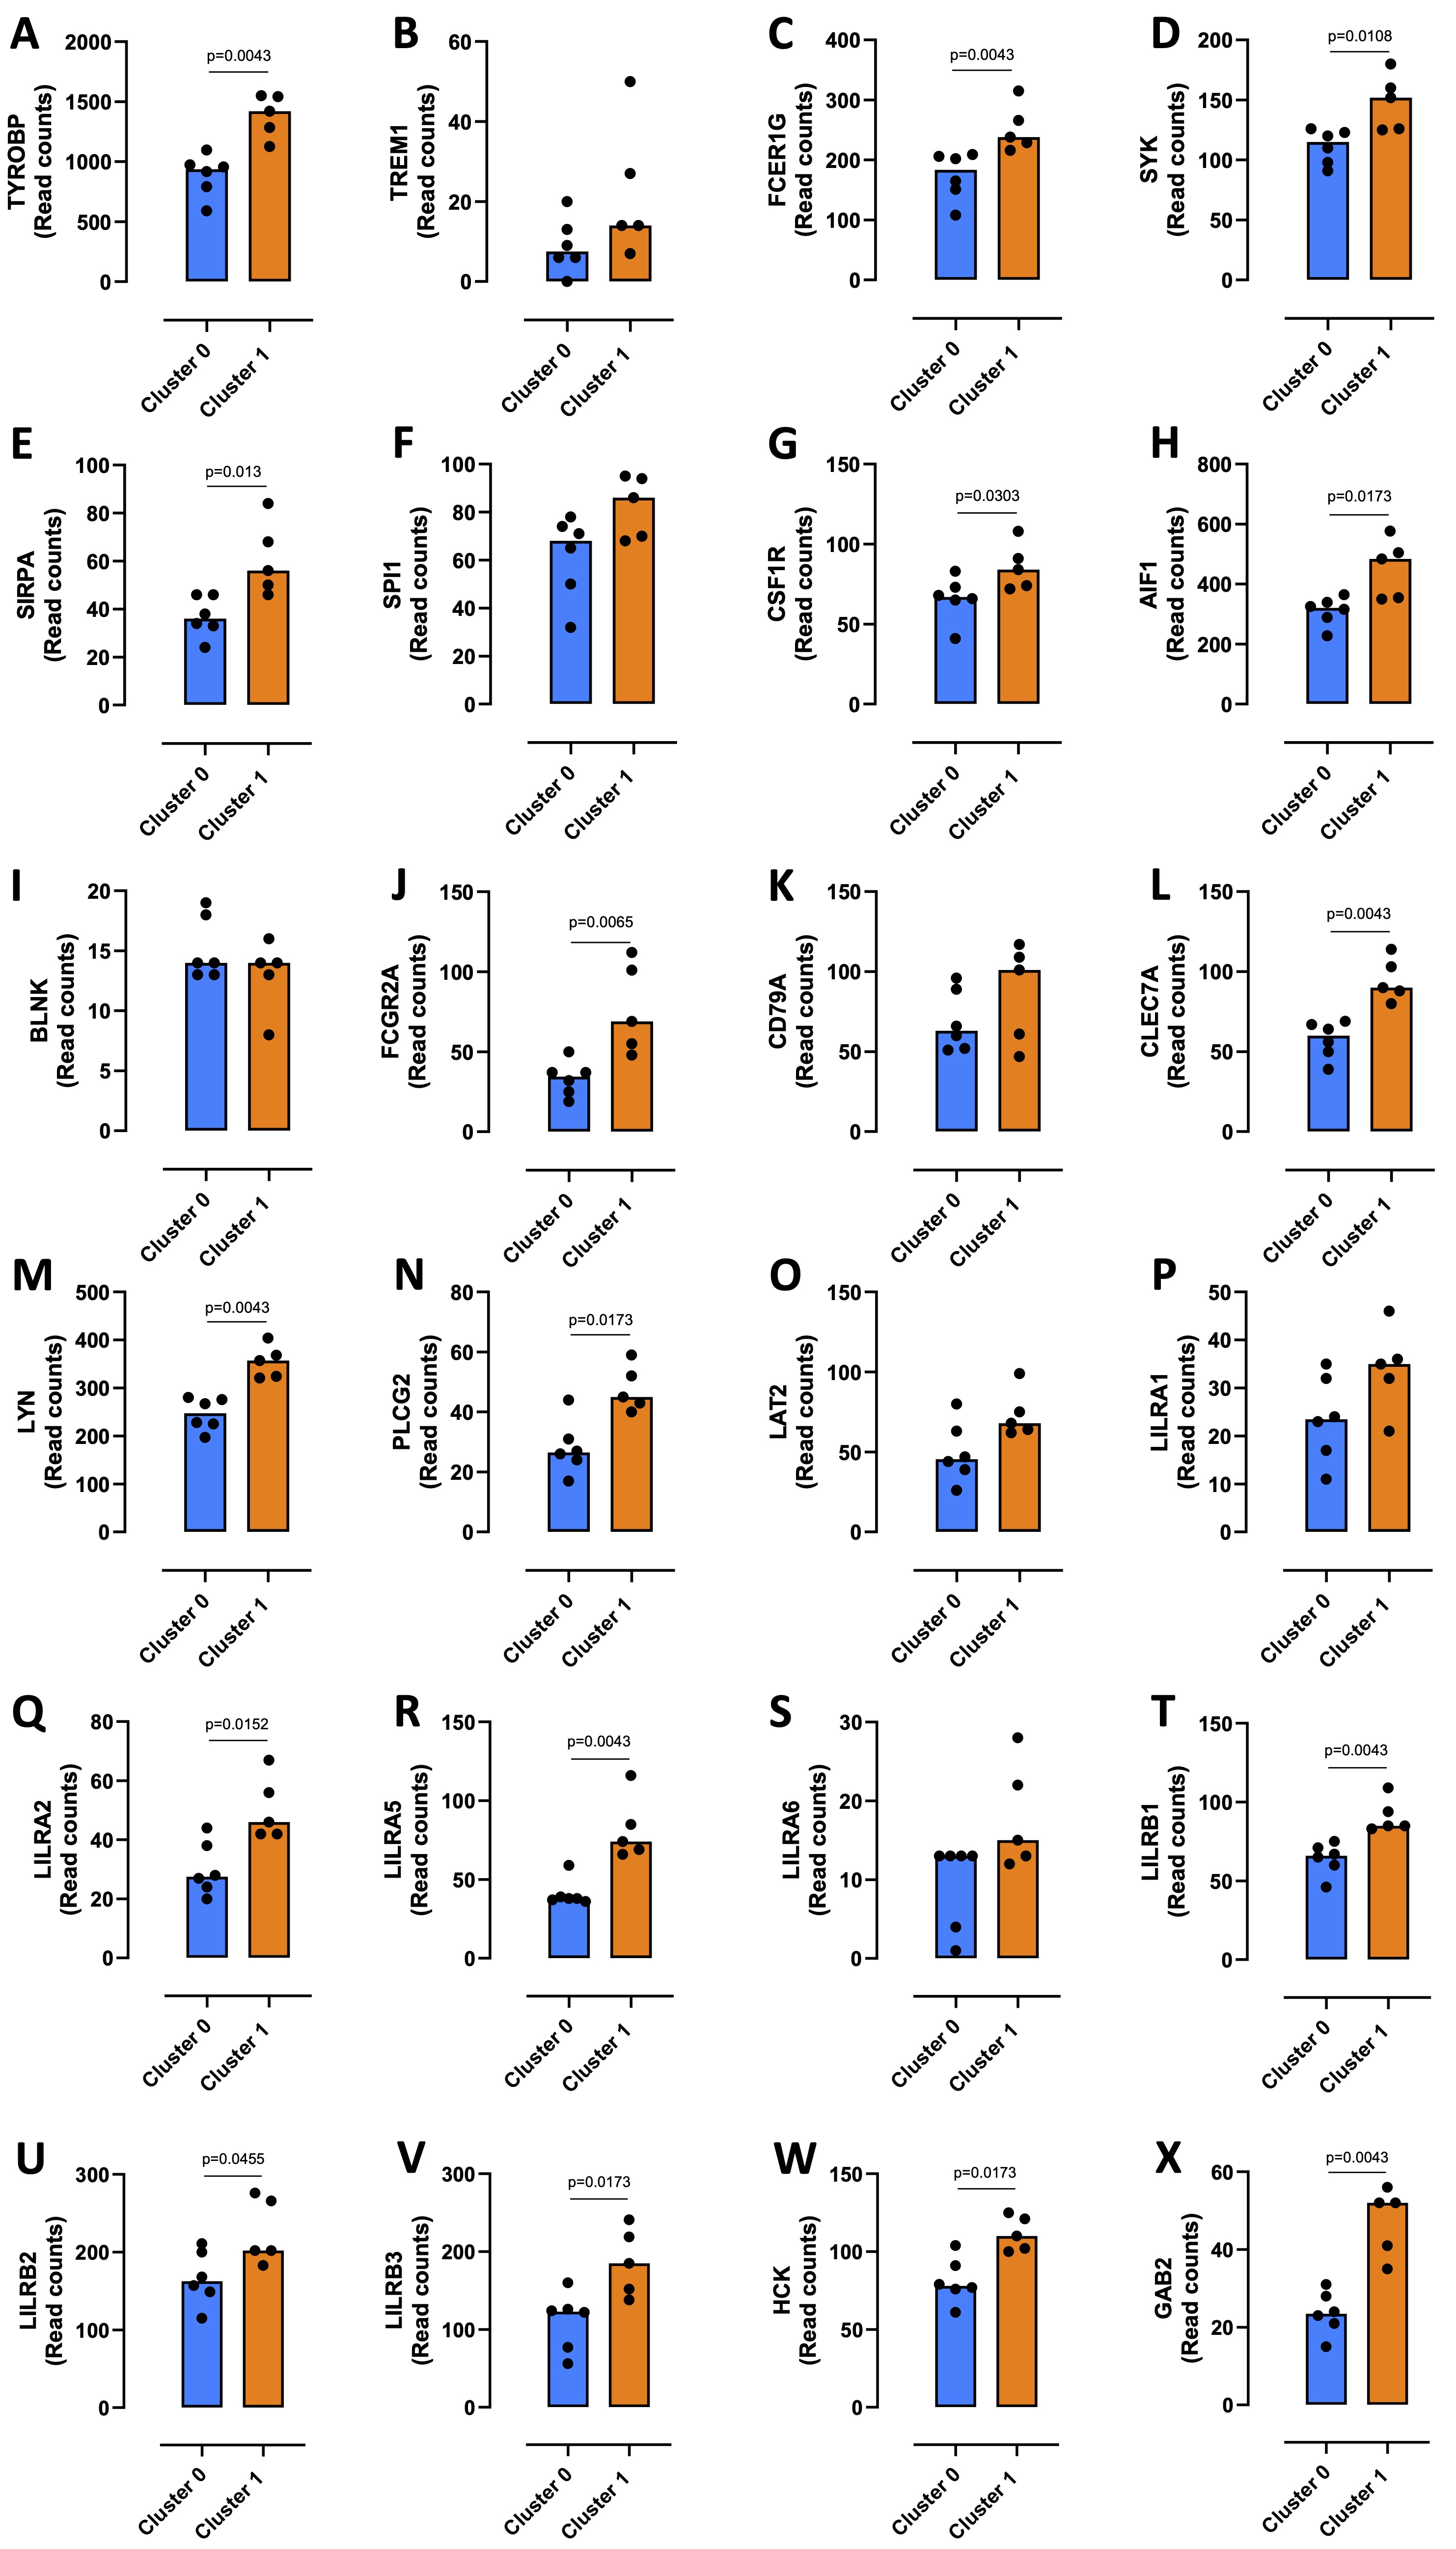
Fig. 6: Expression of sub-cluster 1 immunosuppressive targets. The transcripts expression of TYROBP (A), TREM1 (B), FCER1G (C), SYK (D), SIRPA (E), SPI1 (F), CSF1R (G), AIF1 (H), BLNK (I), FCGR2A (J), CD79A (K), CLEC7A (L), LYN (M), PLCG2 (N), LAT2 (O), LILRA1-2-5-6 (P, Q, R, S), LILRB1-2-3 (T, U, V), HCK (W), GAB2 (X) in cluster 0 and cluster 1 from healthy donors-derived PBMCs (GSE192829) is shown. Data are represented as scatter dot plots indicating the median (confidence interval = 95%). Statistical differences were assessed by means of two-tailed Mann–Whitney U test.
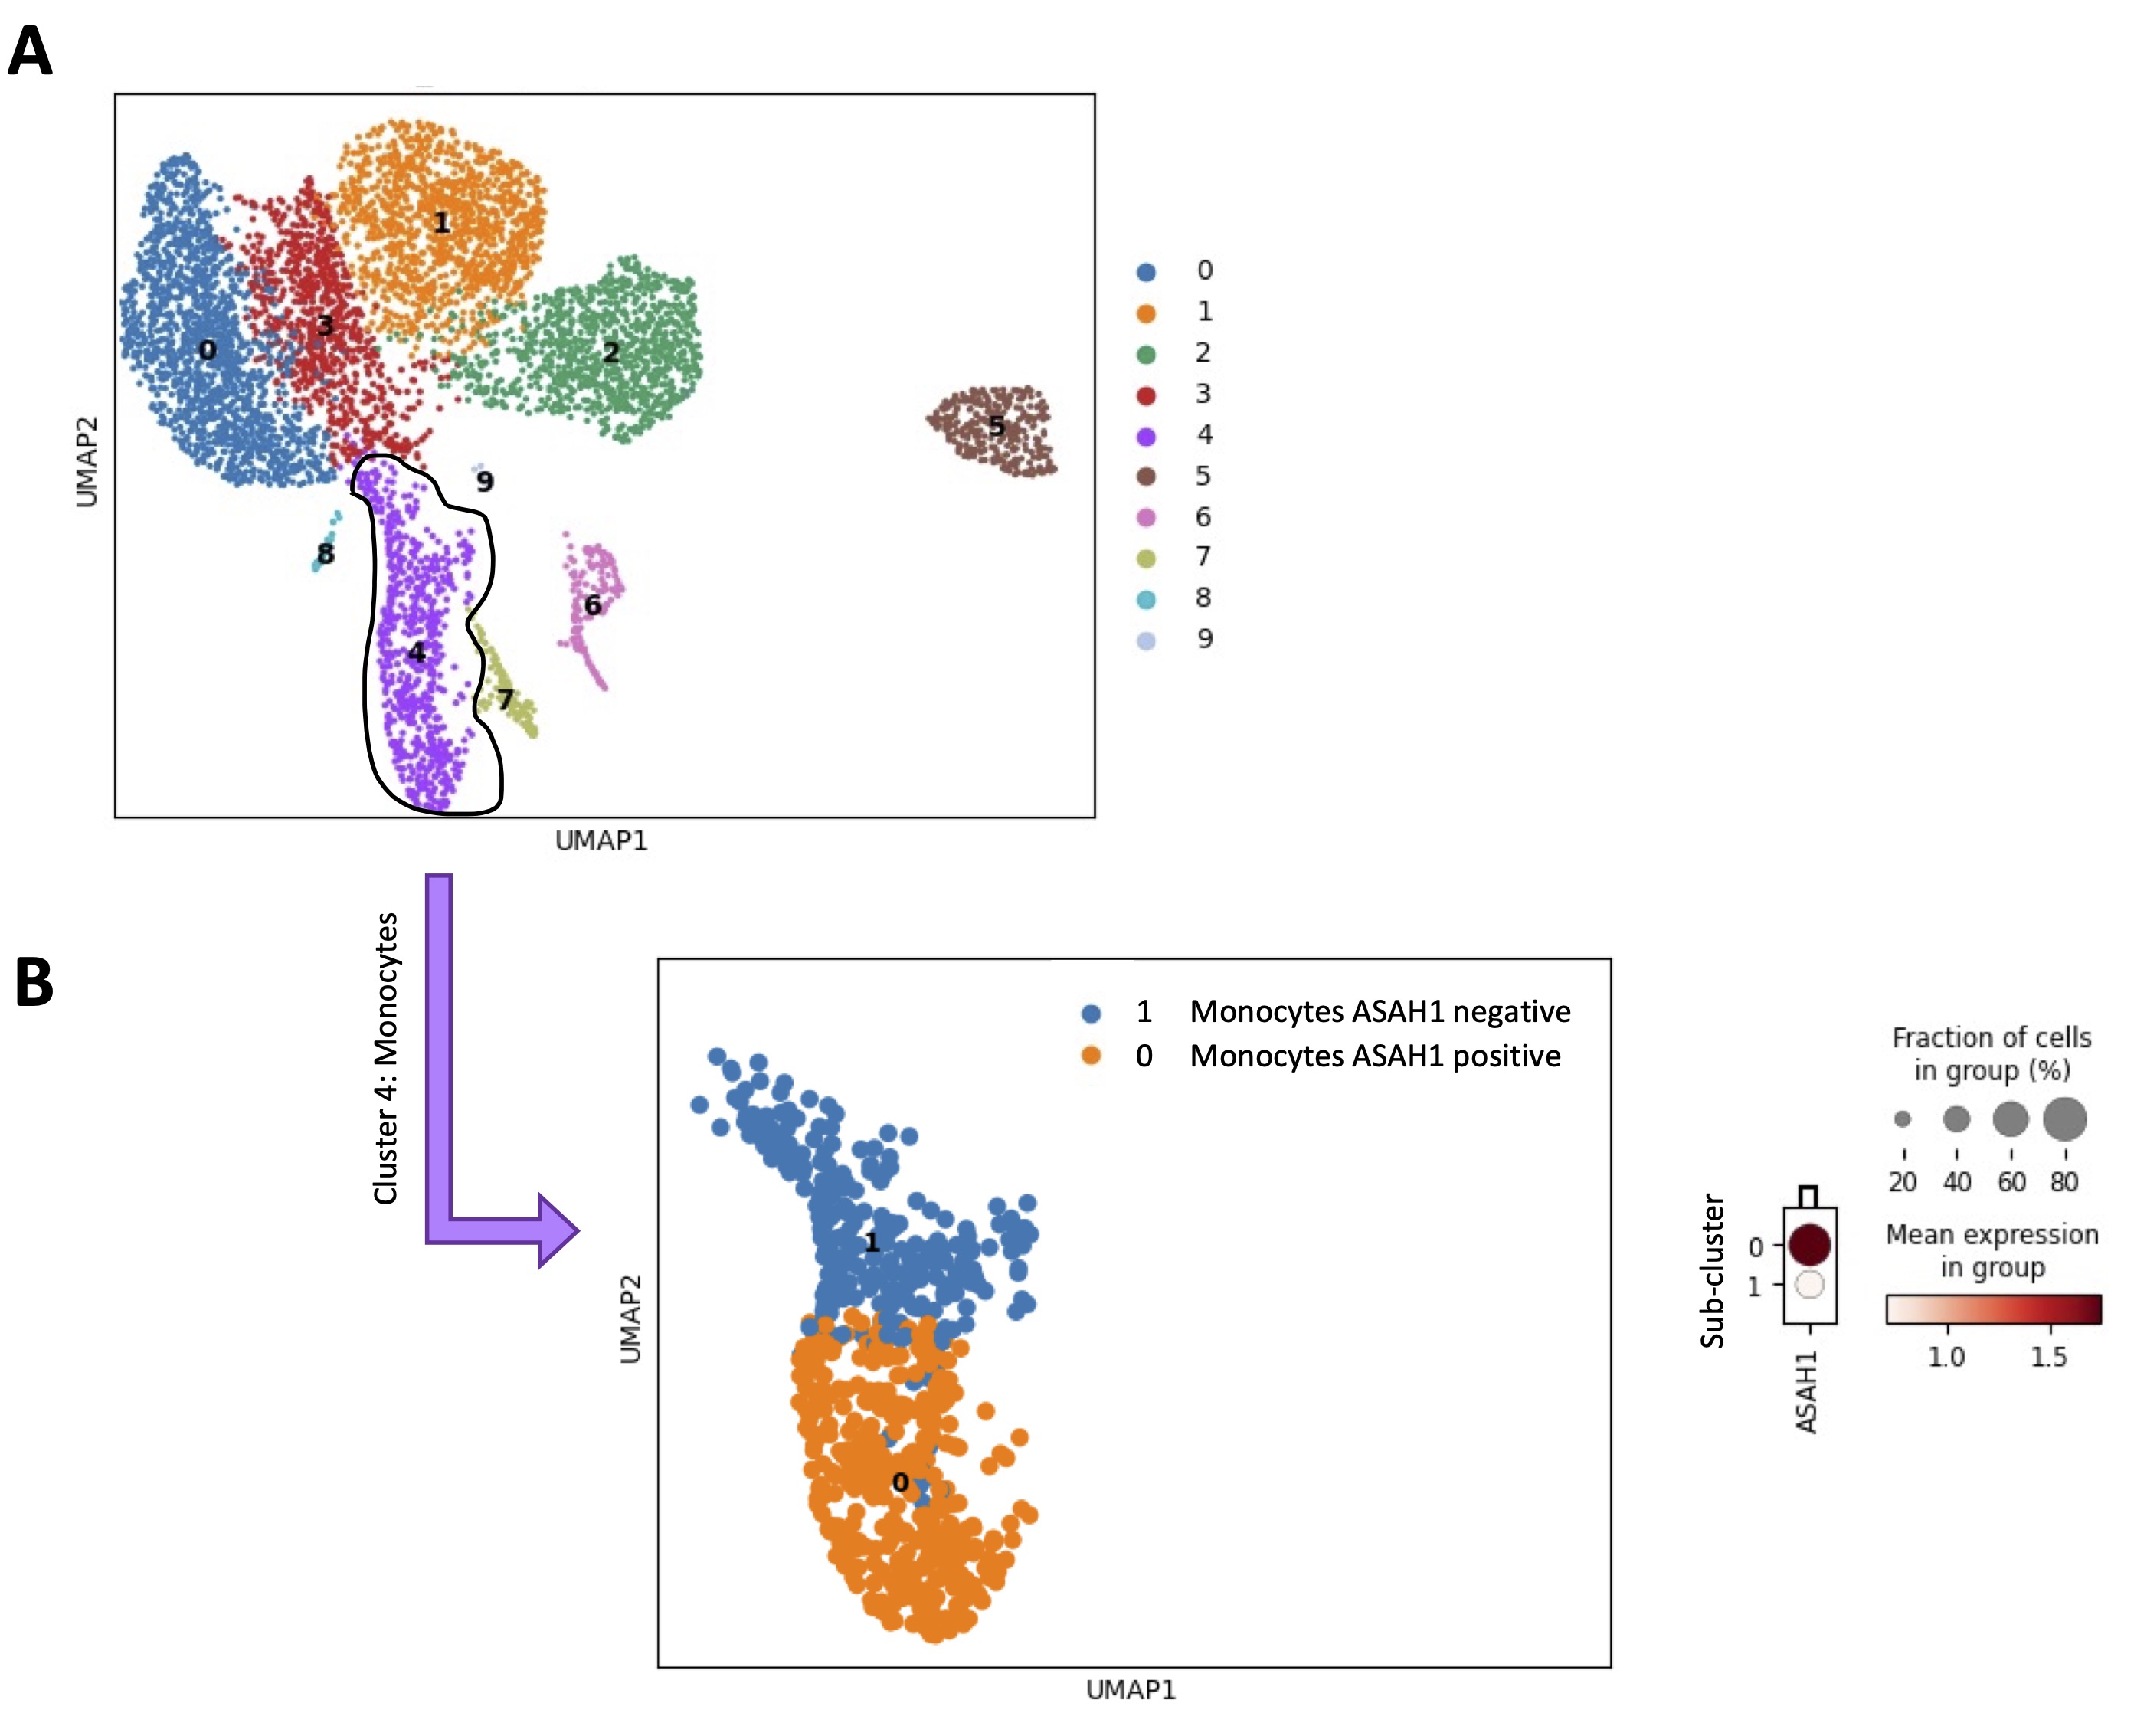
Fig. 7: Monocytes sub-clusterization according to ASAH1 expression. A) Uniform Manifold Approximation and projection (UMAP) representative of the scRNAseq analysis of 6 healthy volunteers-derived PBMCs from GSE235857 dataset; the monocytes were grouped in cluster 4 (violet dots). B) According on ASAH1 expression, the monocytes cluster, sub-clustered in two different populations (ASAH1 positive, sub-cluster 0, orange dots vs ASAH1 negative, sub-cluster 1, blue dots); the score value of ASAH1 was reported into the dendrogram; the color code (light orange to dark red) displays the mean expression of ASAH1 mRNA, and the circle size indicates the fraction of cells in the groups. Data were analyzed according to the Scanpy based on Python by using the following parameters: n_neighbords=20; n_pcs=10; resolution=0.5
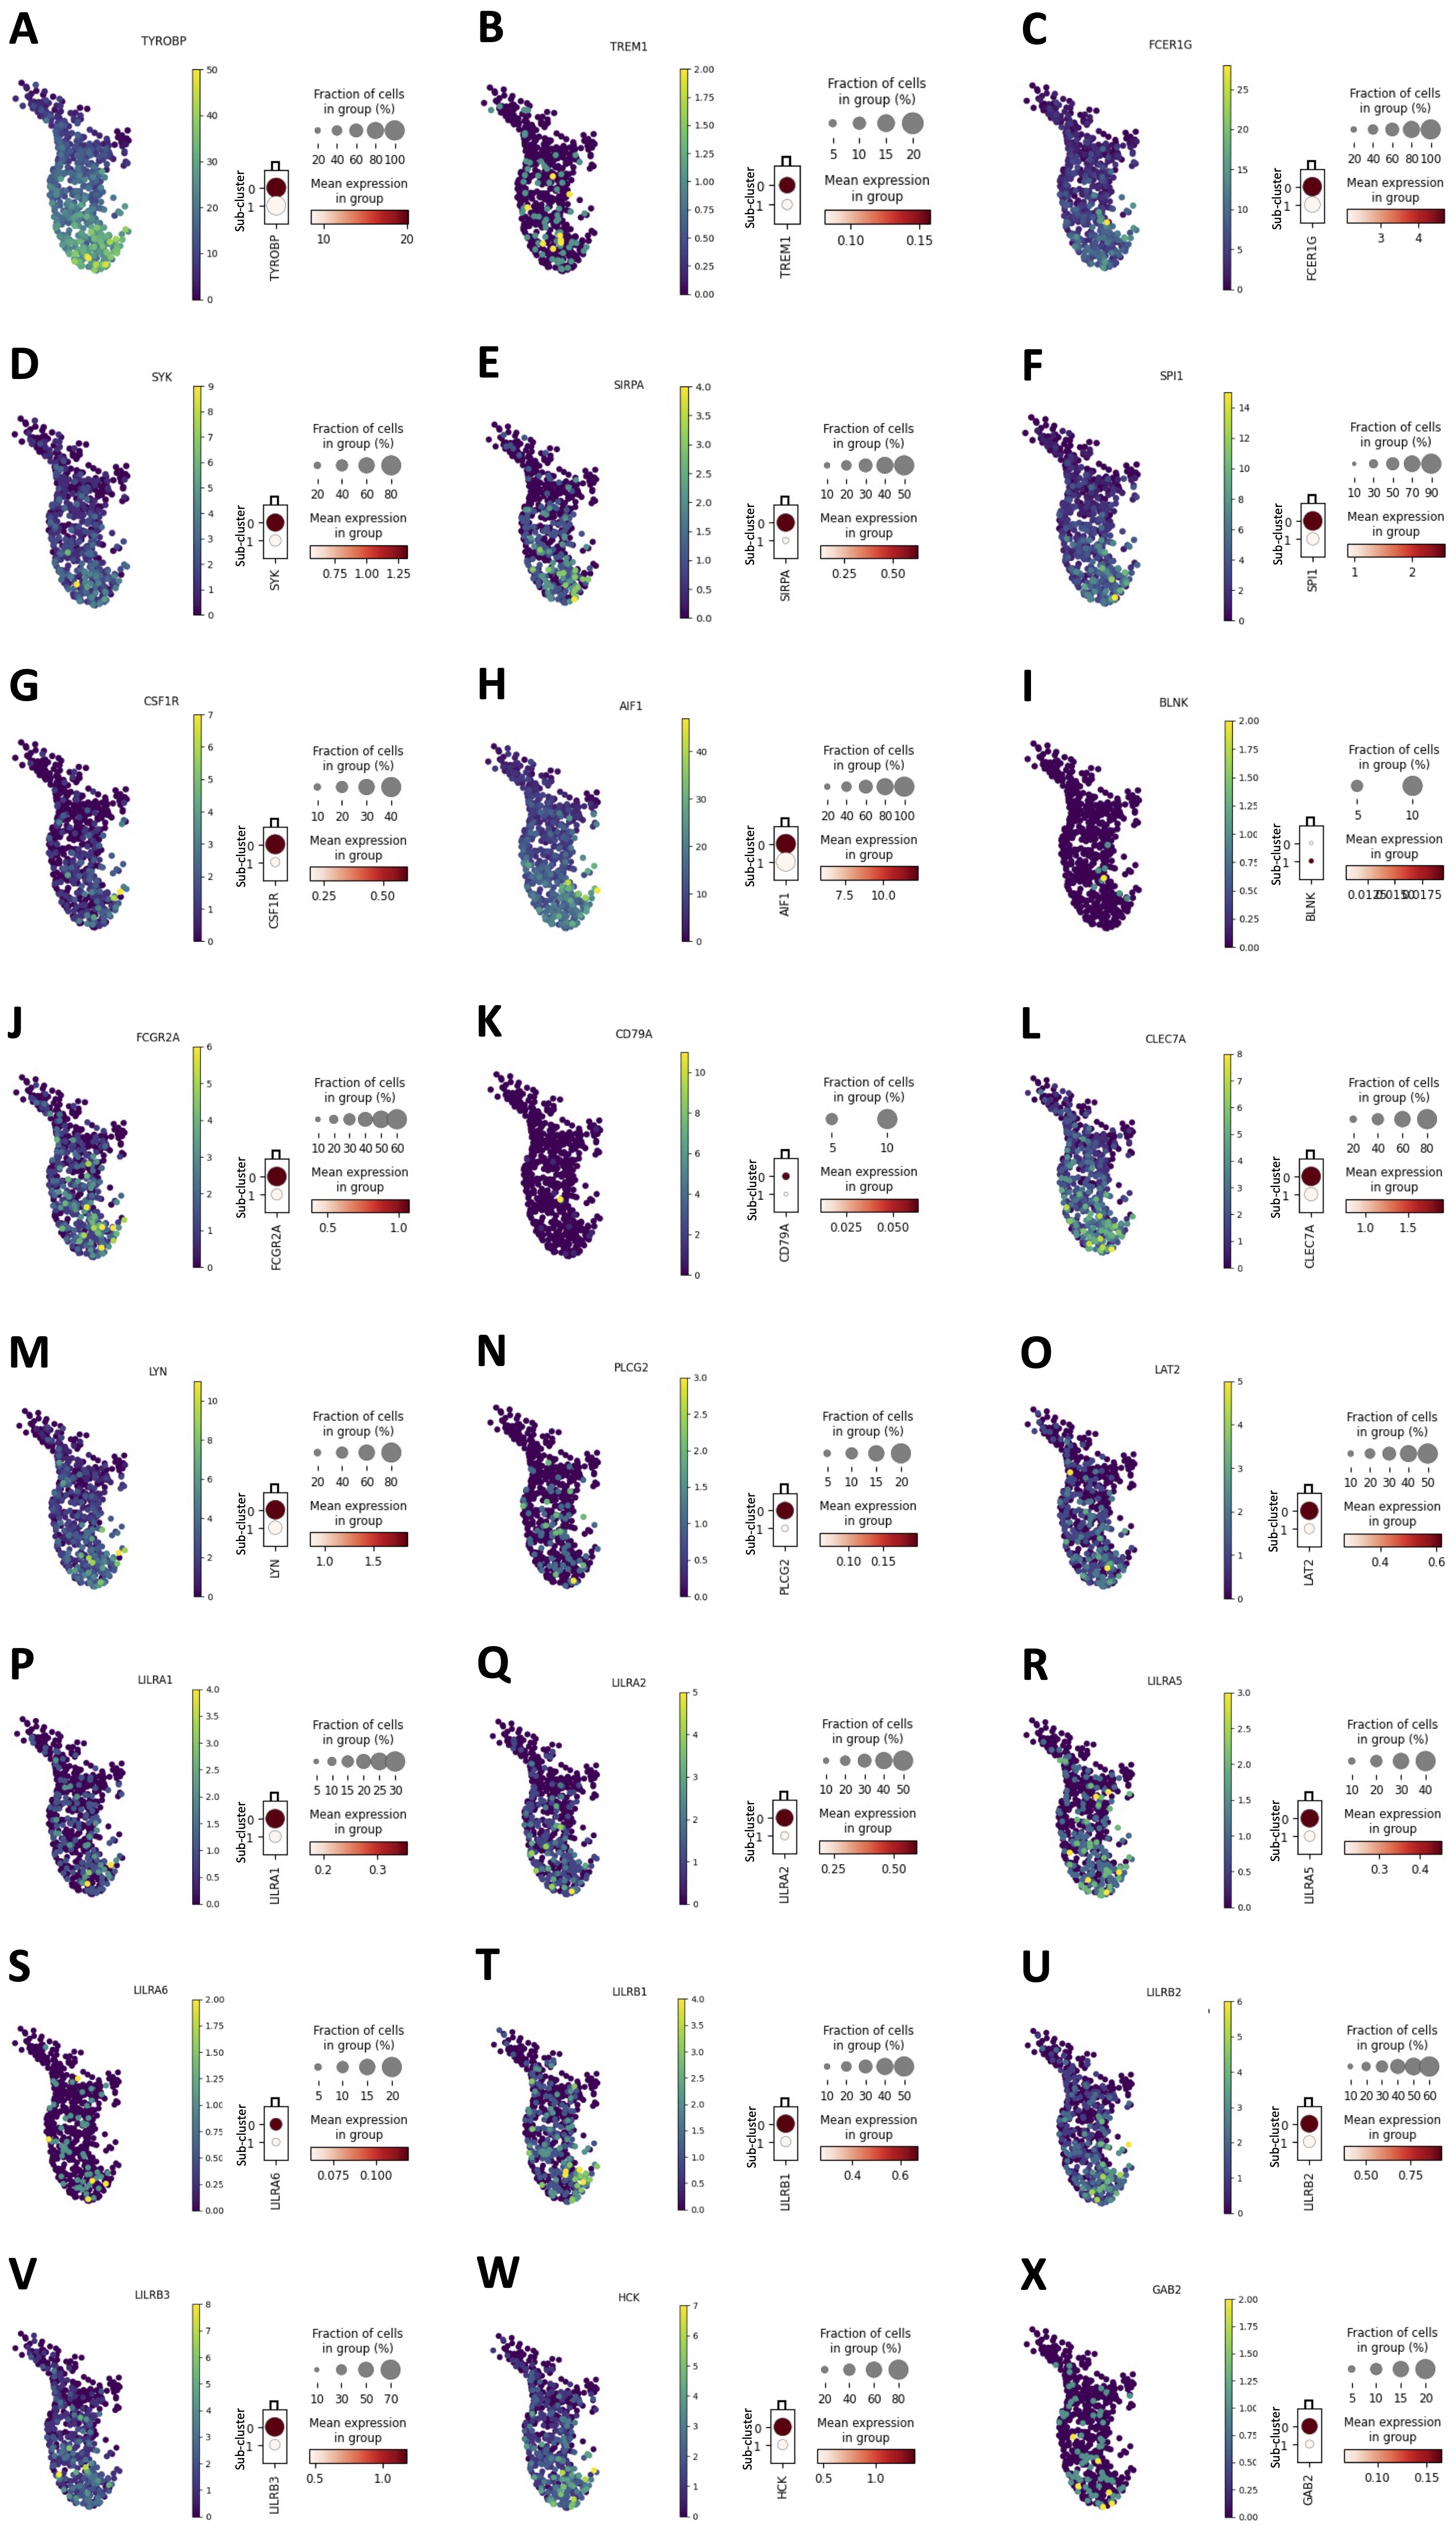
Fig. 8: Immunosuppressive markers expression in monocytes ASAH1 positive vs ASAH1 negative. A public dataset of scRNAseq (GSE235857) of 6 healthy volunteers-derived PBMCs was analyzed. The expression of TYROBP (A), TREM1 (B), FCER1G (C), SYK (D), SIRPA (E), SPI1 (F), CSF1R (G), AIF1 (H), BLNK (I), FCGR2A (J), CD79A (K), CLEC7A (L), LYN (M), PLCG2 (N), LAT2 (O), LILRA1 (P), LILRA2 (Q), LILRA5 (R), LILRA6 (S), LILRB1 (T), LILRB2 (U), LILRB3 (V), HCK (W), GAB2 (X) in ASAH1 positive monocytes sub-cluster (sub-cluster 0) and in ASAH1 negative monocytes sub-cluster (sub-cluster 1) are shown. The dendrograms (representative of a one sample from scRNAseq analysis), report the score value of each immunosuppressive markers; the color code (light orange to dark red) displays the mean expression of each marker, and the circle size indicates the fraction of cells in the groups. Data were analyzed according to the Scanpy based on Python by using the following parameters: n_neighbords=20; n_pcs=10; resolution=0.5.
Discussion
In this study, we have stratified healthy individuals based on the transcriptomic profile of circulating cells, obtaining two clusters, characterized by a differential immunophenotype that have a differential profile of S1P-dependent metabolism/pathway. Higher balance towards the formation of S1P can be at the basis of a different risk to have immune-related dysfunctions, depending on the phenotype of monocytes (Fig. 9). Specifically, we found that:
- Blood cells can have a different transcriptional repertoire (cluster 0 vs cluster 1), regardless sex;
- A differential transcriptomic profile based on S1P metabolism/synthesis can discriminate among healthy subjects;
- Cluster 1 over-expresses the enzymes involved in S1P synthesis and its receptors, while the cluster 0 over-expresses S1P inactivating enzymes, implying a ceramide/sphingosine/S1P imbalance between the two clusters;
- The two clusters are characterized by significant genetic differences in the immune landscape, in that healthy subject-derived PBMCs are enriched of monocytes in cluster 1 compared to cluster 0;
- Cluster 1 monocytes have an immunosuppressive profile;
- An enhanced S1P metabolism/synthesis can shape monocytes as immunosuppressive.
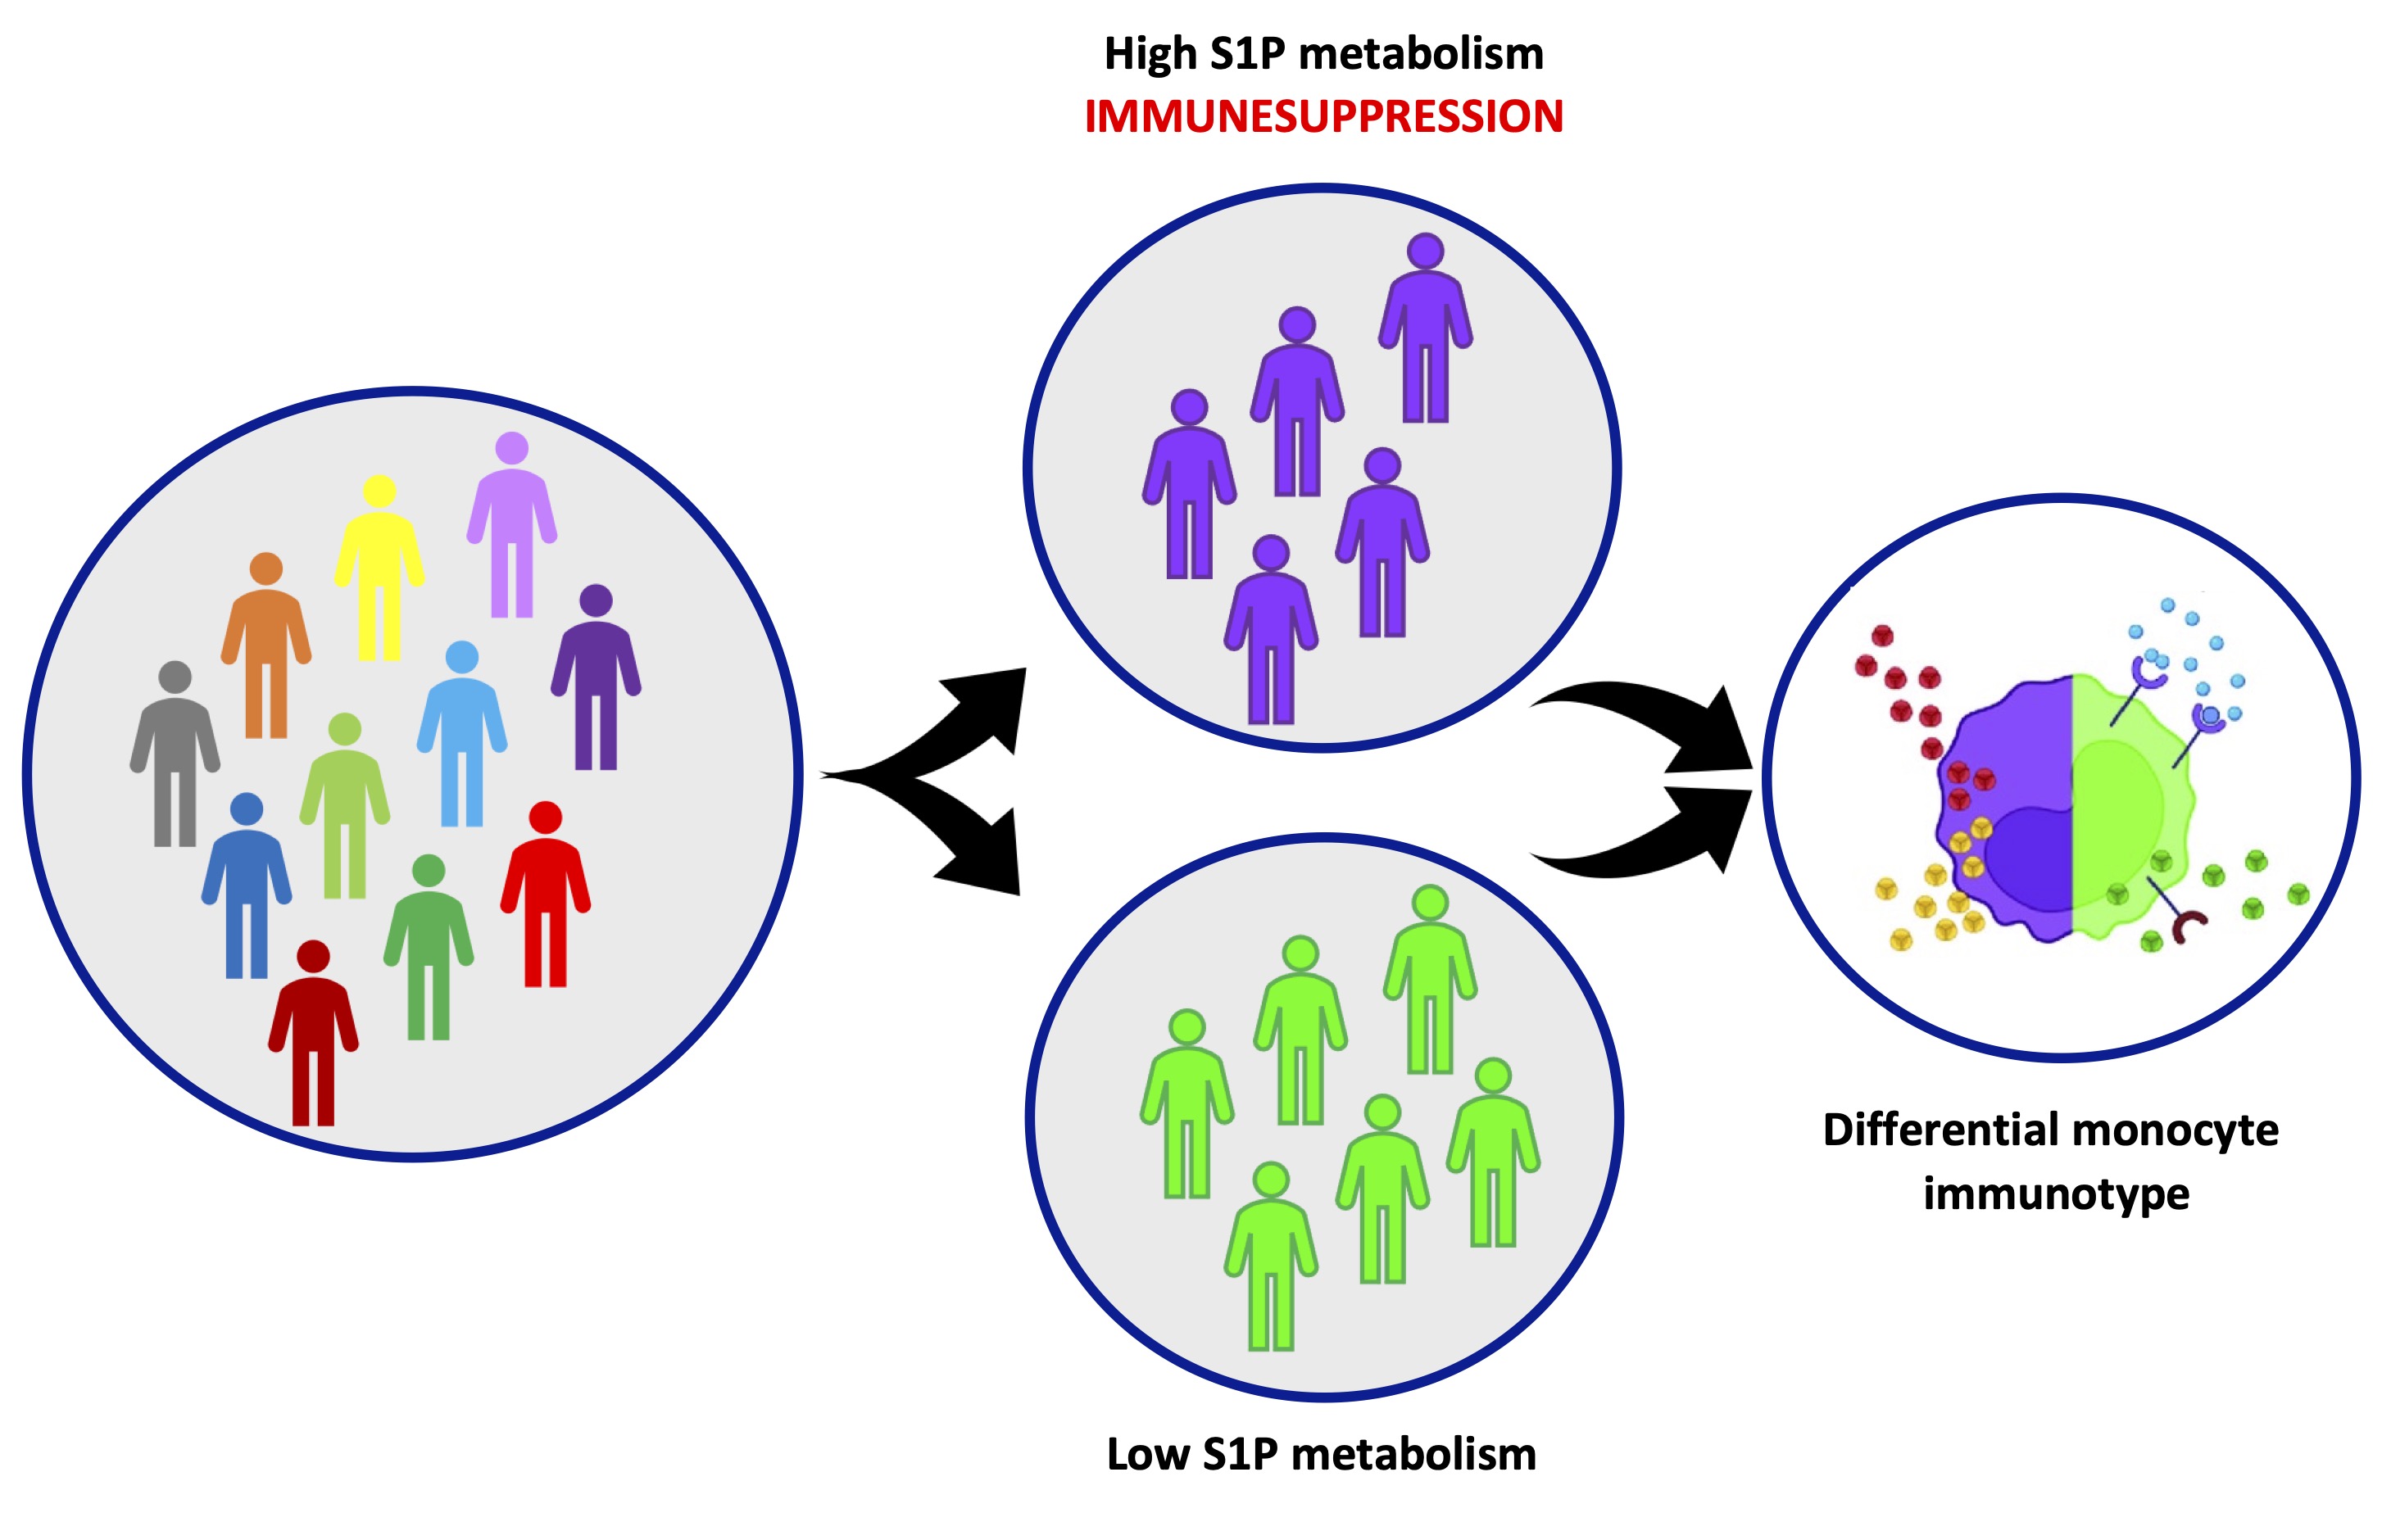
Fig. 9: The variability of the physiological immune response is dependent on the sphingosine-1-phosphate (S1P) metabolism. A heterogenous population of healthy individuals, clusters based on a different transcriptional repertoire and presents a different immunological reactivity, dependent on a high variability in the S1P metabolism/pathway in monocytes.
Our data highlights that an altered S1P metabolic signature together with immunosuppressive monocytes could represent a keystone of the biological variability and variation in terms of immune response. This concept could reflect on the development of specific immune-related disorders.
S1P is a lipidic mediator regulating several physiological processes, such as cell growth, apoptosis, trafficking, differentiation and activation of immune cells, inflammation, cellular architecture, vascular tone control and permeability, cardiac function [9], but its metabolic alteration can be prognostic for the development and progression of diseases. Indeed, an imbalance in S1P pathway and signaling has been associated to the pathogenesis of psoriasis [10], multiple sclerosis (MS) [11], inflammatory bowel disease (IBD) [12], rheumatoid arthritis (RA) [13], systemic lupus erythematosus (SLE) [14], asthma [15], and tumors [16]. In our previous studies, we also demonstrated that a pronounced S1P metabolism/synthesis is involved in the exacerbation of the inflammatory pathway associated to lung cancer [17-18] and that S1P is able to orchestrate immune circulating cells towards lung cancer associated-inflammatory signature [3]. Therefore, a better understanding of the mechanisms by which individuals’ immune system varies might help to develop therapies that target such mechanisms to modulate the immune response, either to alleviate an immune-mediated disorder, such as chronic inflammatory disease or allergy, or to potentiate a desired immune response.
Cluster 1 of PBMCs had an increased transcription of S1P synthesis enzymes and of its receptors, associated with an enrichment of immunosuppressive monocytes. Monocytes are a central component of the innate immune system because they are able to switch their phenotype from a homeostatic state to a pro-inflammatory state. However, depending on the type of stimulus, monocytes can undergo specific polarization and thus acquire distinct functional phenotypes associated to poor immune system reactivity [19]. In the case of cluster 1, the overexpression of S1P-related enzymes leads to suppose that these monocytes are more likely susceptible to polarize towards a phenotype that does not block inflammation but that, rather, facilitates a chronic latent inflammation. Indeed, our analysis of scRNAseq confirms the hypothesis that when S1P metabolism/synthesis is enhanced in healthy monocytes, they present an over-expression of immunosuppressive markers that, in physiological conditions, could alter their immune activity.
An important issue of this study is that an imbalance in S1P metabolism/signaling in favor of S1P activity can lead to immunosuppression that can either reduce the immune response to infections or lead to chronic inflammatory diseases, but on the other hand it could also represent a defense mechanism from the host to avoid autoreactive immune cells. Furthermore, the identification of the stimulus/i that trigger an imbalance of the ceramide/sphingosine/S1P axis during a physiological status, is still an unresolved question. Despite these limitations, our findings propose a still uninvestigated correlation between the sphingolipid metabolism/pathway and the phenotypic switch of healthy monocytes. While cluster 0 shows a reduced S1P synthesis correlated to an unchanged immune profile, cluster 1, as well as being characterized by an increased transcription of S1P synthesis enzymes and related receptors, is predominantly enriched in immunosuppressive monocytes and over-expresses hub transcripts (TYROBP, TREM1, FCER1G, SYK, SIRPA, SPI1, CSF1R, AIF1, BLNK, FCGR2A, CD79A, CLEC7A, LYN, PLCG2, LAT2, LILRA1-2-5-6, LILRB1-2-3, HCK, GAB2) associated with the induction of an immunosuppressive microenvironment. Furthermore, only ASAH1 positive monocytes showed an enrichment of immunosuppressive markers that, instead, were down-regulated in ASAH1 negative monocytes, highlighting S1P signaling/pathway as a potential driver of the phenotypical switch of the monocytes in physiological conditions, affecting the susceptibility of healthy individuals to immune system-mediated diseases, such as inflammatory and/or autoimmune disorders up to cancer.
Nevertheless, this study has some limitations: 1. the study was based on bioinformatic data that should be proved in the real-life world, taking into consideration epidemiologic datasets (if publicly available) and delineate a predictive trajectory to understand what type of disorder this cluster of subjects could be driven to; 2. future proteomic studies, in vitro and ex vivo , will be necessary in order to correlate and corroborate the S1P signature to the induction of an immunosuppressive phenotype in monocytes; 3. the number of subjects was limited; 4. systemic parameters, such as hormonal landscape of these subjects was not available. Regarding this latter point, it has to be noted that cluster 1 was solely comprising females (5 out of 8), whereas cluster 0 was comprising 3 males and 3 females. The 3 females from cluster 0 were younger than or were 45, meaning that most likely the hormonal and endocrine system was not altered. However, the median age of females in cluster 1 was of 46 years, not so different than those from cluster 0, although the latter median age was of 40. Males in cluster 0 had a median age of 42. This implies that further studies need to be performed and that more information are required in published datasets.
The identification of two clusters among the healthy subjects using PBMCs, and the positivity/negativity of the monocytes to S1P signature, may reflect the reality of heterogeneous clinical contexts, and will be of increasing importance for machine learning approaches, in order to maximize efforts to translate a better basic understanding of immune variability into new clinical decisions. Therefore, understanding when and how an individual stable immune system state is established might help us promote the long-term immunological health for all sub-populations. S1P axis could therefore be one of the target pathways to focus on when comparing differential clinical conditions.
Acknowledgements
Author Contributions
MT: conceptualization, data curation, experimental analysis, interpretation of results, statistical analysis, writing original draft, funding acquisition;
AF: software, experimental analysis, statistical analysis;
CC: methodology, experimental analysis;
AP: funding acquisition, visualization, review and editing;
RS: conceptualization, investigation, interpretation of results, visualization, writing review and editing, funding acquisition, supervision.
Funding Sources
This study was supported by PRIN2022 in favor of MT, FARB2023 in favor of MT.
Statement of Ethics
The authors have no ethical conflicts to disclose.
Disclosure Statement
The authors have no conflicts of interest to declare.
References
| 1 | Brodin P, Davis MM: Human immune system variation. Nat Rev Immunol 2017;17:21-29.
https://doi.org/10.1038/nri.2016.125 |
| 2 | Lee M, Lee SY, Bae YS: Functional roles of sphingolipids in immunity and their implication in disease. Exp Mol Med 2023;55:1110-1130.
https://doi.org/10.1038/s12276-023-01018-9 |
| 3 | Terlizzi M, Colarusso C, Somma P, De Rosa I, Panico L, Pinto A, et al.: S1P-Induced TNF-α and IL-6 Release from PBMCs Exacerbates Lung Cancer-Associated Inflammation. Cells 2022;11:2524.
https://doi.org/10.3390/cells11162524 |
| 4 | Terlizzi M, Colarusso C, Ferraro G, Monti MC, Cerqua I, Roviezzo F, et al.: Sphingosine-1-Phosphate Contributes to TLR9-Induced TNF-α Release in Lung Tumor Cells. Cell Physiol Biochem 2021;55:222-234.
https://doi.org/10.33594/000000361 |
| 5 | Terlizzi M, Colarusso C, Ferraro G, Monti MC, Rosa I, Somma P, et al.: Intracellular Sphingosine-1-Phosphate Receptor 3 Contributes to Lung Tumor Cell Proliferation. Cell Physiol Biochem 2021;55:539-552.
https://doi.org/10.33594/000000431 |
| 6 | Yoshioka K, Sato H, Kawasaki T, Ishii D, Imamoto T, Abe M, et al.: Transcriptome Analysis of Peripheral Blood Mononuclear Cells in Pulmonary Sarcoidosis. Front Med (Lausanne) 2022;9:822094.
https://doi.org/10.3389/fmed.2022.822094 |
| 7 | Hu X, Cao D, Zhou Z, Wang Z, Zeng J, Hong WX: Single-cell transcriptomic profiling reveals immune cell heterogeneity in acute myeloid leukaemia peripheral blood mononuclear cells after chemotherapy. 2024;47:97-112.
https://doi.org/10.1007/s13402-023-00853-2 |
| 8 | Gayoso A, Lopez R, Xing G, Boyeau P, Valiollah Pour Amiri V, Hong J, et al.: A Python library for probabilistic analysis of single-cell omics data. Nat Biotechnol 2022;40:163-166.
https://doi.org/10.1038/s41587-021-01206-w |
| 9 | Hla T: Physiological and pathological actions of sphingosine 1-phosphate. Semin Cell Dev Biol 2004;15:513-520.
https://doi.org/10.1016/j.semcdb.2004.05.002 |
| 10 | Zhao Y, Zhang Y, Li J, Zhang N, Jin Q, Qi Y, et al.: Pathogenic sphingosine 1-phosphate pathway in psoriasis: a critical review of its pathogenic significance and potential as a therapeutic target. Lipids Health Dis 2023;22:52.
https://doi.org/10.1186/s12944-023-01813-3 |
| 11 | Pérez-Jeldres T, Alvarez-Lobos M, Rivera-Nieves J: Targeting Sphingosine-1-Phosphate Signaling in Immune-Mediated Diseases: Beyond Multiple Sclerosis. Drugs 2021;81:985-1002.
https://doi.org/10.1007/s40265-021-01528-8 |
| 12 | Dal Buono A, Gabbiadini R, Alfarone L, Solitano V, Repici A, Vetrano S, et al.: Sphingosine 1-Phosphate Modulation in Inflammatory Bowel Diseases: Keeping Lymphocytes Out of the Intestine. Biomedicines 2022;10:1735.
https://doi.org/10.3390/biomedicines10071735 |
| 13 | Inoue T, Kohno M, Nagahara H, Murakami K, Sagawa T, Kasahara A, et al.: Upregulation of sphingosine-1-phosphate receptor 3 on fibroblast-like synoviocytes is associated with the development of collagen-induced arthritis via increased interleukin-6 production. PLoS One 2019;14: e0218090.
https://doi.org/10.1371/journal.pone.0218090 |
| 14 | Tian J, Huang T, Chang S, Wang Y, Fan W, Ji H, et al.: Role of sphingosine-1-phosphate mediated signalling in systemic lupus erythematosus. Prostaglandins Other Lipid Mediat 2021;156:106584.
https://doi.org/10.1016/j.prostaglandins.2021.106584 |
| 15 | Roviezzo F, Sorrentino R, Terlizzi M, Riemma MA, Iacono VM, Rossi A, et al.: Toll-Like Receptor 4 Is Essential for the Expression of Sphingosine-1-Phosphate-Dependent Asthma-Like Disease in Mice. Front Immunol 2017;8:1336.
https://doi.org/10.3389/fimmu.2017.01336 |
| 16 | Pyne NJ, Pyne S: Recent advances in the role of sphingosine 1-phosphate in cancer. FEBS Lett 2020;594:3583-3601.
https://doi.org/10.1002/1873-3468.13933 |
| 17 | Terlizzi M, Colarusso C, Ferraro G, Falanga A, Monti MC, Somma P, et al.: Sex Differences in Sphingosine-1-Phosphate Levels Are Dependent on Ceramide Synthase 1 and Ceramidase in Lung Physiology and Tumor Conditions. Int J Mol Sci 2023;24:10841.
https://doi.org/10.3390/ijms241310841 |
| 18 | Terlizzi M, Colarusso C, Falanga A, Somma P, De Rosa I, Panico L, et al.: Induction of Inflammation Disrupts the Negative Interplay between STING and S1P Axis That Is Observed during Physiological Conditions in the Lung. Int J Mol Sci 2023;24:8303.
https://doi.org/10.3390/ijms24098303 |
| 19 | Guglietta S, Krieg C: Phenotypic and functional heterogeneity of monocytes in health and cancer in the era of high dimensional technologies. Blood Rev 2023;58:101012.
https://doi.org/10.1016/j.blre.2022.101012 |