The Absence of an Na+/Ca2+Exchanger (NCX) in Bullfrog Proximal Tubules and Cellular pH is More Influential Than Cellular Ca2+ on Proximal Na Transport
aOsaka Medical College (present Osaka Medical and Pharmaceutical University), 2-7 Daigakumati, Takatsuki, Osaka, Japan,
bMatsumura Mental Healthcare Clinic, 2-8-1 Nakayamadera, Takarazuka, Hyogo, Japan
Keywords
Abstract
Background/Aims:
The functional significance of the Na+/Ca2+ exchanger (NCX) in basolateral membranes in the proximal tubule remains controversial. The key factor in crosstalk between the apical and basolateral sides is not known.Methods:
We investigated the basolateral membranes, using double-barreled Ca2+ or pH ion–selective microelectrodes. We used doubly perfused bullfrog kidneys in vivo, and switched the basolateral solution (renal portal vein) to experimental solutions.Results:
In the control, cellular pH (pHi) was 7.33 ± 0.032 (mean ± SE, n = 7) and in separate experiments, cellular Ca2+ activity (aCai) was 249.6 ± 35.54 nM (n = 28). Changing to respiratory acidosis, pHi was significantly acidified by 0.123 pH units on average and the change of aCai was +53.1 nM (n = 9 ns). In metabolic acidosis, pHi was reduced by 0.151 while aCai was reduced by 143.4. Using the 30 mM K+ solution, pHi was increased by 0.233 while aCai was reduced by 203.9, with depolarization. Both ionomycin and ouabain caused aCai to increase. In the 0.5 mM Na+ solution (replaced with BIDAC Cl), pHi was reduced by 0.177. No changes in aCai (+49.8 ns) were observed although we recorded depolarization of 15.2 mV. In the 0.5 mM Na+ solution, replaced with raffinose, no changes in aCai (−126.4 ns) were observed with depolarization (6.5 ns).Conclusion:
Our results suggest that thermodynamic calculations of cellular Na+ concentration led to the conclusion that either a Na+/HCO3− exchanger (NBC) or NCX could be present in the same basolateral membrane. H+ ions are the most plausible key factor in the crosstalk.Introduction
The functional significance of the Na+/Ca2+ exchanger (NCX) on basolateral membranes in proximal tubules remains controversial (Zhuo JL and XC Li (2013)). Lee et al. (1980), Friedman et al. (1981), Lorenzen et al. (1984), Yang et al. (1988), Dominguez et al. (1989), and Dominguez et al. (1991) suggested the presence of an NCX in the proximal tubules. Mandel et al. (1984) and Fujimoto et al. (1989), however, suggested that there is no NCX in basolateral membranes in proximal tubules but that instead, intracellular calcium pools within the mitochondria and elsewhere contribute to Na+/Ca2+ exchange.
The localization of NCX in basolateral membranes of proximal tubules is also controversial. Most studies, with the exception of Dominguez et al. (1992), have reported that NCX localization is restricted to the distal convoluted tubule (Ramachandran and Brunette (1989), Yu et al., 1992, Lee GS, KC Choi, and EB Jeung, 2009, (K+-dependent Na+/Ca2+ exchanger 3)), the connecting tubule (Reilly et al., 1993; Bourdeau et al., 1993; Lytton et al., 1996), and the cortical collecting duct (Reilly et al., 1993).
In kidneys suffering from ischemia-reperfusion and in renal tubular epithelial cells subjected to hypoxia/reoxygenation, NCX extrudes Na+ in exchange for Ca2+ influx, resulting in intracellular Ca2+ overload and tubular epithelial cell injury (Yamashita J, S Kita, T Iwamoto et al., 2003, Yang D, D Yang, 2013). The S3 segment of the proximal tubule, which maintains the delicate balance between high O2 demand and low basal O2 tension in the corticomedullary region, is the portion of the nephron most vulnerable to ischemia (Parker et al., 2015). Based on this theory, the reversed mode of NCX in proximal tubules, particularly the S3 segment, is required.
In ventricular myocytes, intracellular Na+ is centrally involved in regulation of cardiac Ca2+ and contractility by the way of an Na+/H+ exchanger (NHE1), NCX, and Na+ channel (Despa S et al., 2002). The NHE1 and Na+/HCO3− cotransporter (NBC) are spatially separate in the heart. NHE1 is expressed at intercalated disc and gap junctions; NBCe1 and NBCn1 are expressed in transverse tubules. Nevertheless, they coordinately facilitate Na+ influx, intracellular alkalinization, and ultimately Ca2+ loading of the sarcoplasmic reticulum for excitation-contraction coupling (Garciarena CD et al., 2013). In proximal tubules, the NHE1, NBC, and NCX are not known to be coordinated.
We investigated coordination of the NBC and NCX on the basolateral side of bullfrog proximal tubules.
Although urine is finally modified in subsequent tubules, the proximal tubule is the main site for both NaCl and NaHCO3 reabsorption. This process is activated by the basolateral membrane’s Na+/K+ ATPase. Hence, the Na+/K+ ATPase is an important site for maintaining Na+ transport under many acid–base and abnormal electrolyte conditions. Apical Na+/H+ exchanger (NHE) also regulates Na+ transport as a gate. Why a serosal (basolateral) side maneuver inhibits cellular Na+ transport was the central question. Cellular factors such as cellular pH or cellular Ca2+ appear to be key factors for regulating Na+ transport in the crosstalk between the apical and basolateral sides.
Taylor and Windhager (1979) proposed the Ca2+ hypothesis to explain the inhibition of Na+ transport by quinidine, calcium ionophores (A-23187, X-537A), eliminating sodium from the medium bathing the serosal or inner surface, ouabain, and potassium-free media. According to their hypothesis, these changes cause intracellular Ca2+ activity to increase across the basolateral membrane thanks to the NCX.
Boron and Boulpaep (1983) discovered the electrogenic NBC in basolateral membranes of the proximal tubule. These finding raised the heterogeneity of the nephron and the difference in ion transport epithelia, such as the coexistence of both NCX and NBC.
Harvey and Ehrenfeld (1988) proposed the cellular H+ hypothesis to explain the inhibition of Na+ transport by cellular acidification (close talk by the H+ ion). Such acidification is caused by the amiloride-sensitive Na+/H+ exchanger located on the basolateral membrane of frog skin.
It is difficult to monitor changes in cellular pH and cellular Ca2+ with changes in membrane potential difference (PD) within the cell. Many studies have been performed with single-ion selective microelectrodes with separate conventional microelectrodes inserted into the vicinity of the cell. It is preferable to use double-barreled ion-selective microelectrodes for this purpose. In this study, we used double-barreled ion-selective microelectrodes to determine the presence of NCX in basolateral membranes of the bullfrog proximal tubule. We therefore investigated the crosstalk between the apical and basolateral sides using these double-barreled microelectrodes.
Materials and Methods
Animal experimental protocols were approved by the Institutional Animal Care and Use Committee, Osaka Medical College (presently Osaka Medical and Pharmaceutical University). All surgery was performed under urethane anesthesia and all efforts were made to minimize animal suffering.
The method for double perfusion of bullfrog kidneys described previously (Fujimoto and Morimoto, 1986). Male bullfrogs, weighing 100–150 g, were anesthetized with 3% urethane and immobilized by pithing. Both kidneys were exposed from the ventral side. The luminal and peritubular surfaces of the tubule cells were separately perfused with the indicated solutions (aorta and portal vein, each). A renal portal system supplies impure blood from the lower part of the body like the hepatic portal system. This dual system, comprising the renal artery and renal portal systems, is found in all vertebrates except for mammals, hagfish, and lampreys (Holz PH, 1999). Doubly perfused kidneys use the renal artery to supply the luminal side, where blood is filtered by the glomeruli, and the renal portal system to supply the peritubular side. Structural features enable the renal portal system to predominate over the renal artery in the perfusion of peritubular capillaries when the glomerular filtration rate is lowered (Tamura K & T Akutsu, 1930, Ohtani O & I Naito,1980). Cell impalements were performed on the left kidney in vivo.
Intracellular Ca activities (Cai) or pH (pHi) were measured with double-barreled Ca or H-selective liquid ion exchanger (LIX) microelectrodes. In some experiments, single Ca-selective microelectrodes were also employed with conventional microelectrodes impaled in the neighborhood of the cell. Assuming that the Ca activity coefficient (γCa = 0.38 at 25°C) was the same in the Ca standard solutions, extracellular fluids, and intracellular fluids, with common values of ionic strength (I = 0.11–0.12), we estimated the Ca activity from the calibrated values on the diagram of concentration vs. EMF (electromotive force of output of double-barreled microelectrode) (Fig. 2).
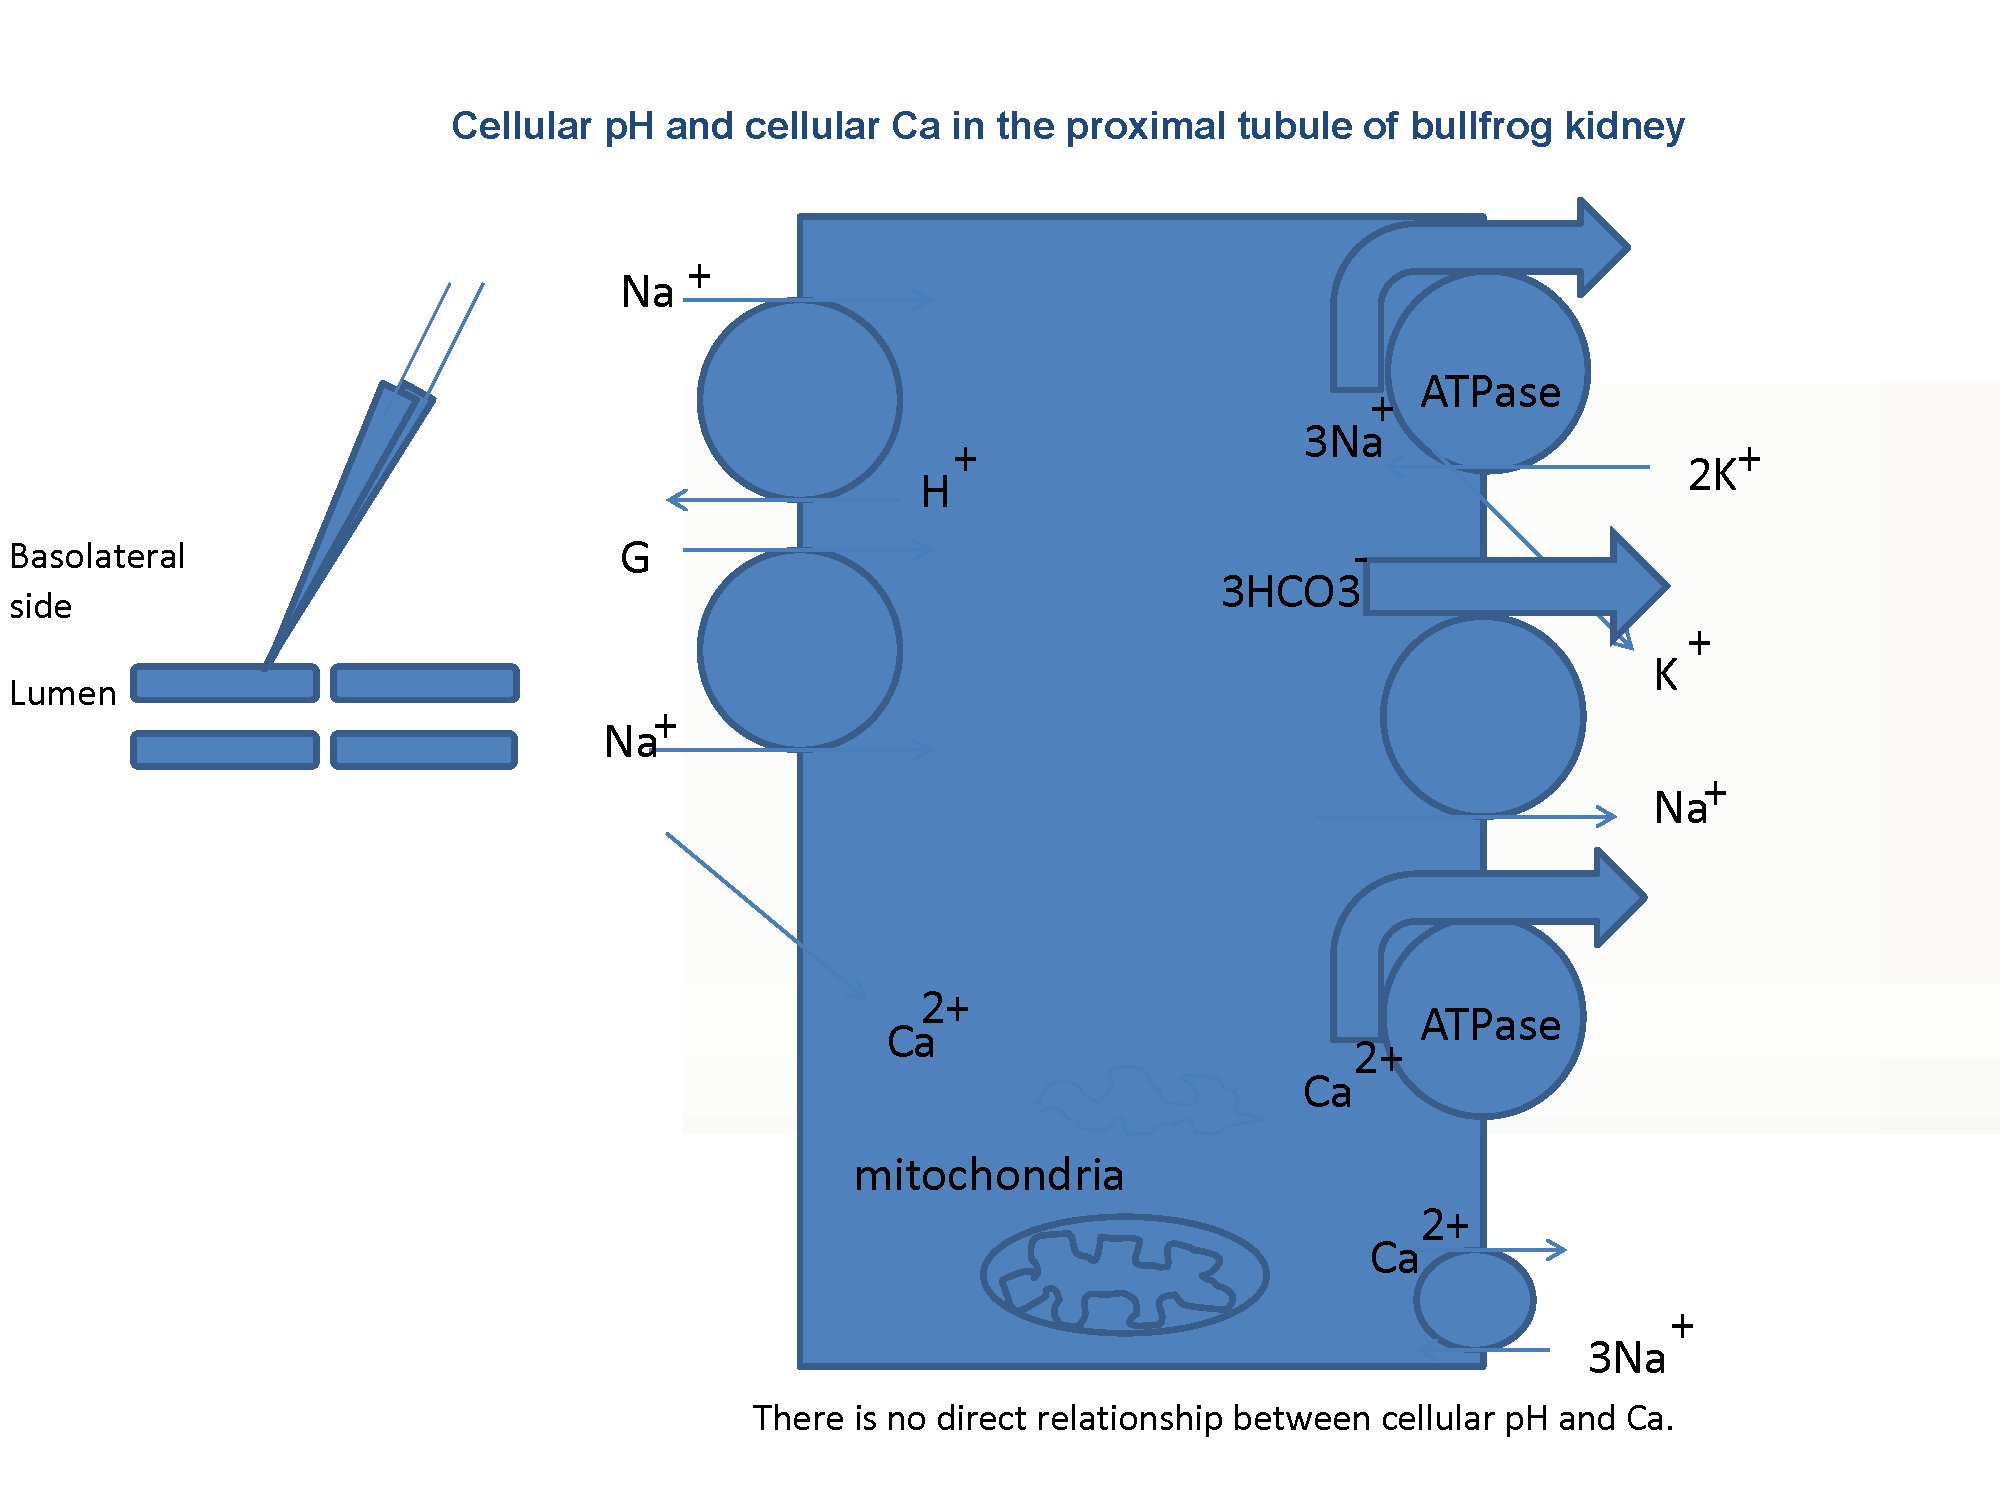
Fig. 1:Schema of the experiment. The presence of the Na–Ca exchanger on the basolateral membrane is the key issue addressed in this study.
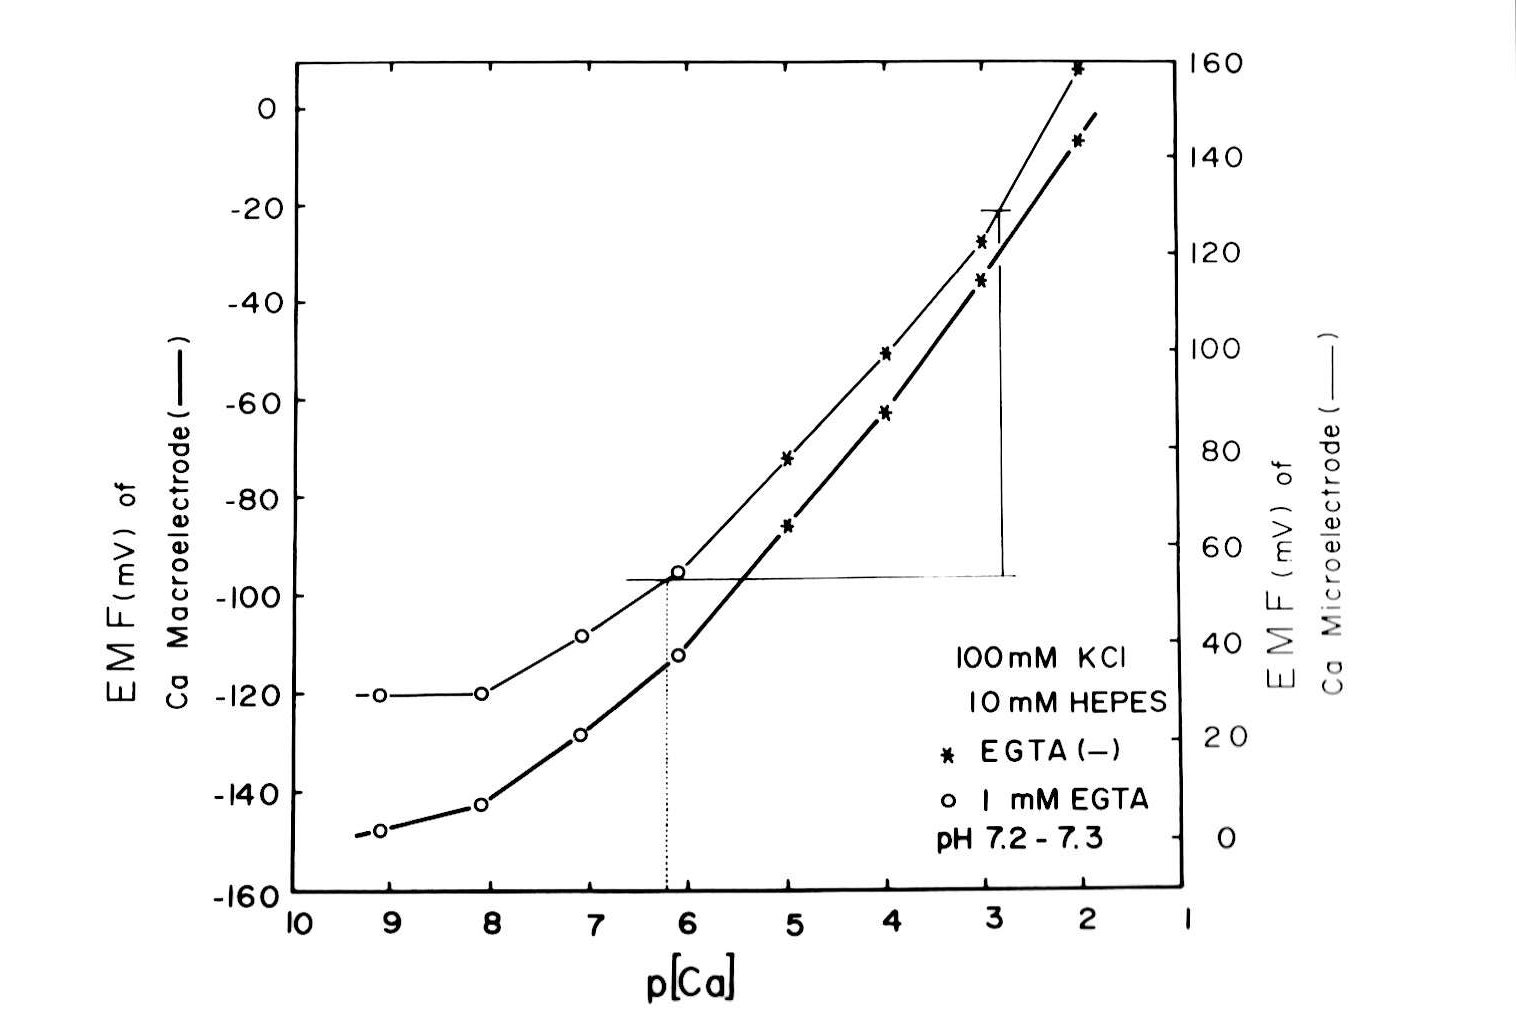
Fig. 2:Assuming that the Ca2+ activity coefficient (γCa = 0.38 at 25°C) was the same in the standard Ca2+ solutions, extracellular fluids, and intracellular fluids, with common ionic strength values (I = 0.11–0.12), we estimated Ca2+ activity from the calibrated values on the diagram of concentration vs. EMF (electromotive force of the double-barreled microelectrode output). The resulting curves for both the Ca2+-selective macroelectrode is and the doubled-barreled Ca2+-selective microelectrode are non-linear.
Methods for microelectrode fabrication were described in detail previously (Fujimoto and Kubota, 1976). The resistances of the PD barrel (filled with 3 M KCl) of the double-barreled Ca-selective microelectrode were within 50–100 MΩ. We beveled the electrode by performing two or three touches on alumina powder (0.06 × 10⁻⁴ cm in particle diameter) floated on the surface of frog Ringer solution just before impalement, using a beveling system (WPI Model 1200, F-29). The tip of the electrode, except 30 µm from the end, was coated with electrically conductive chemicals (Fujikura Kasei, Tokyo). Usually, the microelectrode could be kept within the cell for more than 30 min. This procedure allowed control cell Ca activity to be measured with certainty despite the slow response time of the microelectrode and the possibility of cell damage (Fig. 2). The time required for the full response of the microelectrode at the cellular Ca activity level was about 5 min, which might attenuate any transient change in cellular Ca activity (aCai). However, once it was fully equilibrated within the cell, it accurately detected changes in aCai. The values we adopted are Ca activity obtained 5 min after the treatment. We often observed changes in the EMF of the Ca-selective barrel, but not in the PD barrel after a cell impalement. Impalement into the cell through the renal capsule could break the extreme tip of the microelectrode. Hence, we decided not to use this microelectrode for consecutive cell impalements. From a practical point of view, we accepted an impalement if the EMF of the Ca barrel after the impalement did not deviate by more than a few mV from the initial surface level. In this study, the EMF change (mean ± SE) in the Ca barrel was +2.8 ± 1.4 mV (Fig. 2).
Before undertaking these studies, we carefully examined the properties of the Ca resin (Oehme et al., 1976). In the physiological range, the electrode had little effect on pH, i.e., at pH 7.33 and p [Ca] 5.25, the mean ± SE p [Ca] deviation from the reading of the Ca-selective glass macroelectrode (TOA, Ca-135) was 0.09 ± 0.06 (n = 5), and at pH 7.71 and p [Ca] 6.42, it was 0.15 ± 0.08 (n = 5). The selectivity coefficient, −log KCa M (the suffix M represents Na, K, or Mg), was very low: e.g., −logKCa Na was 5.22 ± 0.14 (n = 7, γCa = 0.38), as determined by the fixed interference method (FIM); −logKCa K was 4.60 ± 0.25 (n = 7, γCa = 0.38, FIM); and −logKCa Mg was 7.09 ± 0.67 (n = 5; separate solution method, SSM), indicating that this electrode does not significantly interfere with the Ca response from either of these ions at physiological concentrations.
All experiments were done at room temperature (20–25°C). Only early segments of proximal tubules were used. The solutions that were perfused basolaterally are shown in Table 1.
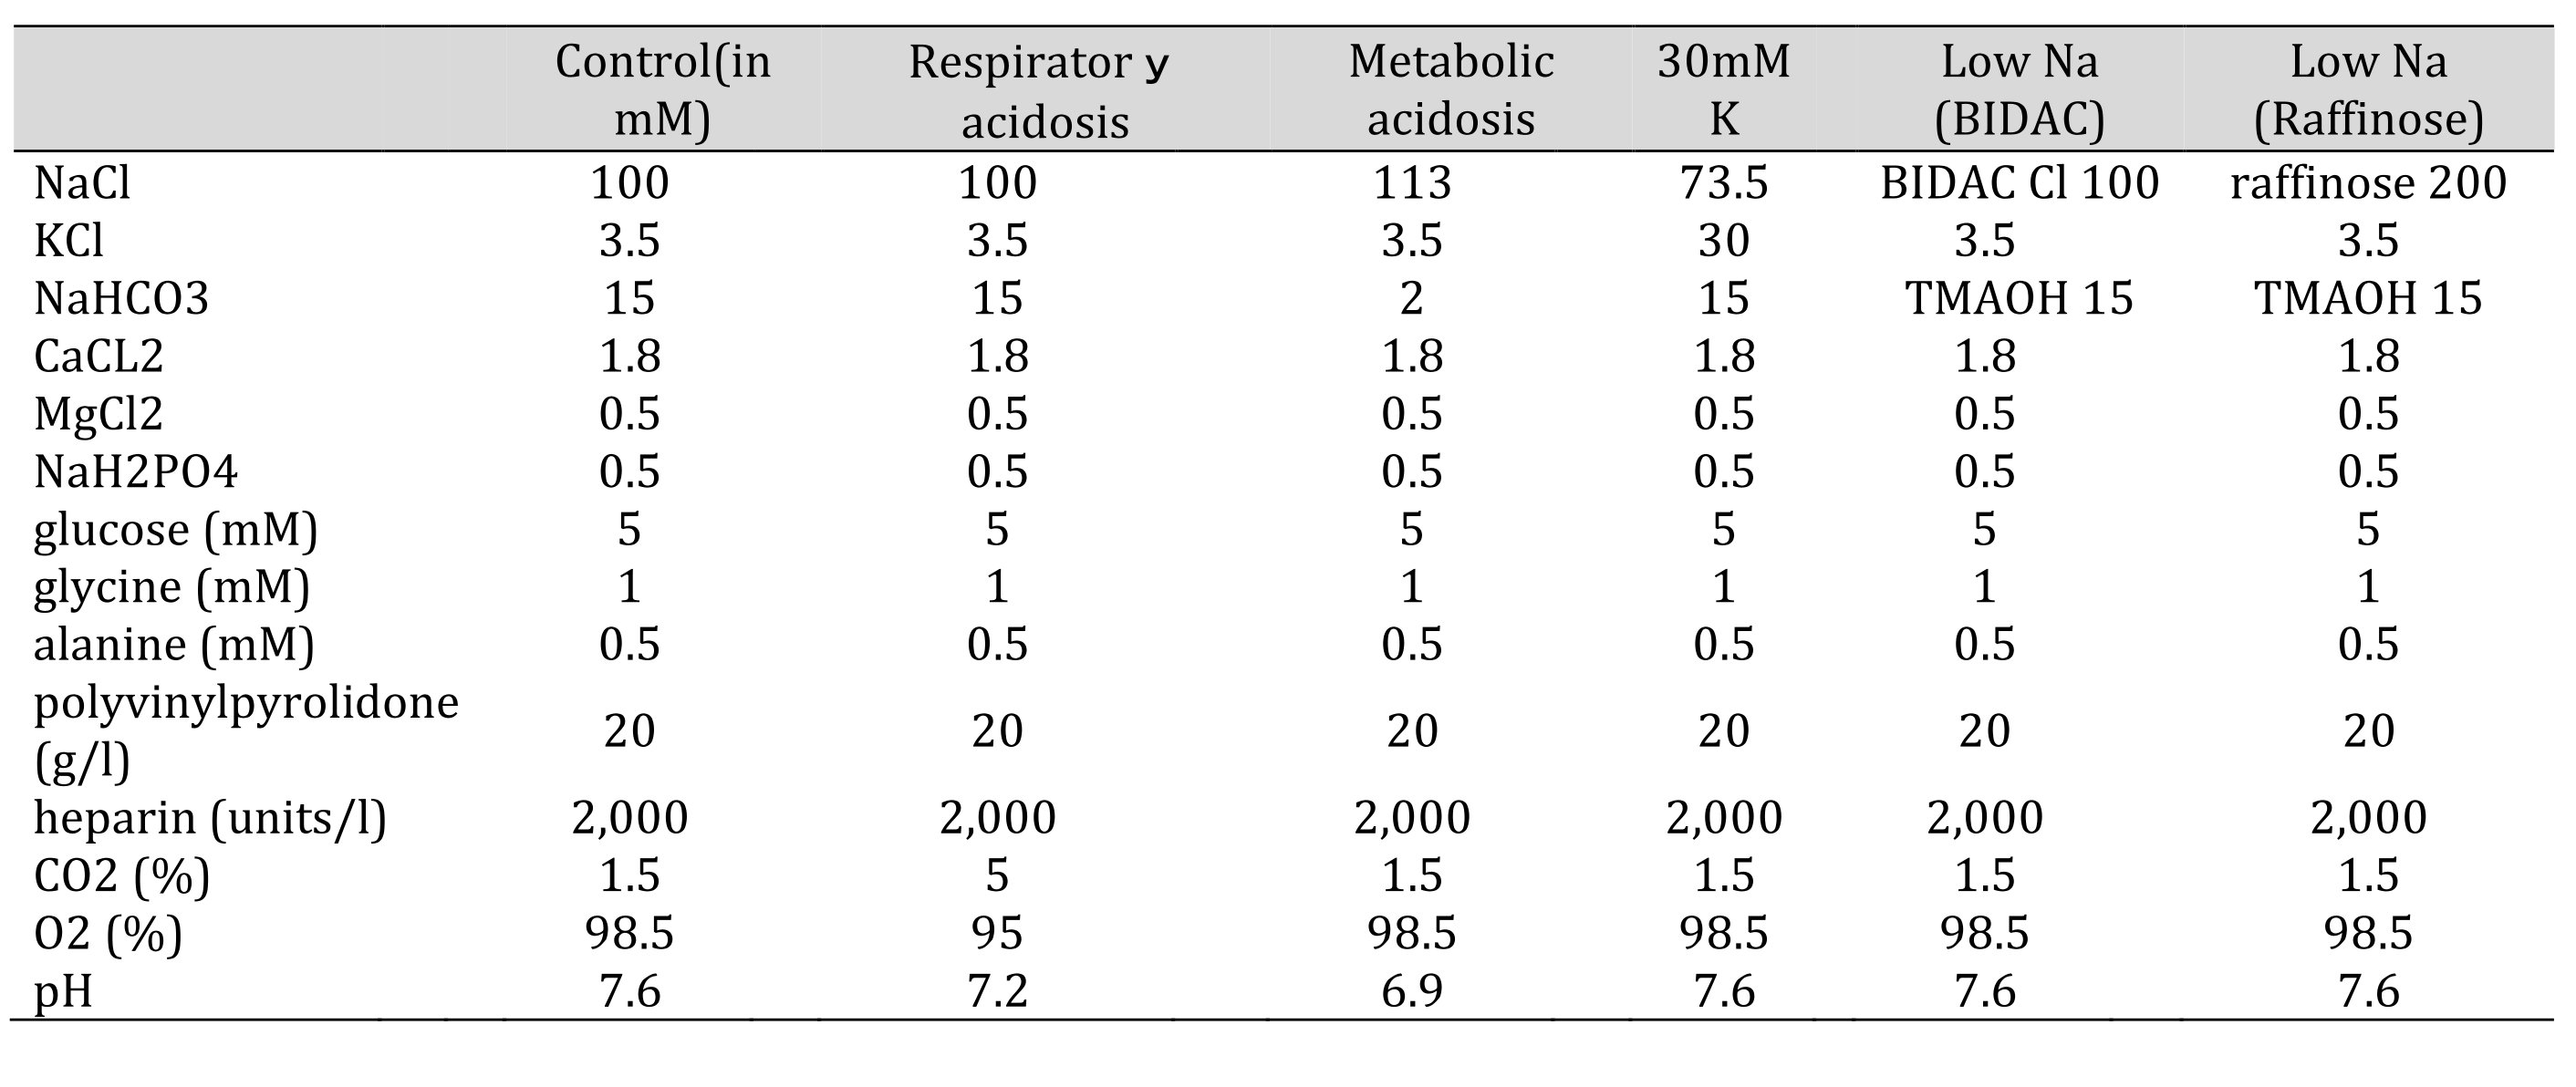
Table 1: Solutions used in this study. Glucose, glycine, alanine, polyvinylpyrolidone (PVP), and heparin were not changed. The osmolarity was checked before every experiments. 15 mM TMAOH was bubbled with 1.5% CO2. Control(in mM) Respiratory acidosis Metabolic acidosis 30mMK low Na(BIDAC) low Na(Raffinose)
Calculation of cellular Na and electrochemical driving force for Na across the basolateral membrane of tubular cells
One way to determine cellular Na activity is to calculate cellular HCO3 using the modified Henderson–Hasselbalch equation with the measured pHi. Then, cellular Na activity can be determined from the thermodynamic equilibrium equation using the calculated value for HCO3. Using the calculated cellular Na activity, aCai can be estimated from the thermodynamic equilibrium equation.
The other way to determine cellular Na activity is to calculate it from the thermodynamic equilibrium equation, using the measured aCai. The calculation of cellular HCO3 is obtained from a thermodynamic equation using the calculated cellular Na activity. Then, pHi is estimated from the Henderson–Hasselbalch equation using the calculated HCO3 activity.
We assumed that ion concentration is the molar concentration and obtained the activity coefficient for each ion from the Debye–Hueckel formula (Kielland, 1937). At an ionic strength (I) of 0.1 and 25°C, H+ is 0.86, Na+ is 0.82, HCO3− is 0.82, K+ is 0.805, and Ca+ is 0.485 (we adopted 0.38).
1. Estimation of cellular HCO3− concentration from cellular pH (Rose and Post,2001).
At 22°C, the Henderson–Hasselbalch equation (Kajino et al., 1981) was,
pH = 6.348 + log (γHCO3− × [HCO3]/0.046 × pCO2) (1)
where [HCO3] is expressed in mM and pCO2 in mmHg.
If γHCO3− assumed to be 0.82, then
[H+](nM) = K' × 0.046 × pCO2/γHCO3− × [HCO3−] = 448.7 × 0.046 × pCO2/0.82 × [HCO3−]
= 20.6/0.82 × pCO2 /[HCO3−] = 25.1 × pCO2/[HCO3−](2)
where K' = 10−pK = 106.348 = 448.7 nM/L.
[HCO3−] = 25.1 × pCO2/[H+] (nM)(3)
Where [HCO3−] is the chemical concentration and pH = paH (Bates, 1973).
2. Estimation of cellular Na activity from cellular HCO3−.
2-1. In the case of stoichiometry Na+–3HCO3−,
Nai = 102/2.3x0.04xVbl × (HCO3−o/HCO3−i)3 × Nao (4)
2-2. In the case of stoichiometry Na+–2HCO3−,
Nai = 101/2.3x0.04xVbl × (HCO3−o/HCO3−i)2 × Nao(5)
where Nai is activity in the case of Nao activity and Vbl is expressed in mV.
3. Estimation of aCai from HCO3− .
3-1. in the case of a Na+–Ca2+ exchanger,
3-1-1. in the case of stoichiometry Na+–3HCO3−,
Cai = 10−2.174x0.04xVbl × (HCO3−o/HCO3−i)3 × Cao(6)
3-1-2. in the case of stoichiometry Na+–2HCO3−,
Cai = 10−2.174x0.04xVbl × (HCO3−o/HCO3−i)2 × Cao(7)
where Cai is activity in case of Cao activity.
3-2. in the case of a 3Na+–Ca2+exchanger,
3-2-1. in the case of stoichiometry Na+–3HCO3−,
Cai = 10−4.7826x0.04xVbl × (HCO3−o/HCO3−i)9 × Cao(8)
A summary of this calculation is shown in Tables 6–9 (see Discussion).
If we adopt the stoichiometry Na+–2HCO3− (Mueller-Berger et al., 2001), the calculated Nai activity will be 33.96 mM in the control. However, this was not the case (14.4, Kajino and Fujimoto, 1982; 10.5, Cemerikic and Giebisch, 1981; 12.8, Yang et al., 1988).
Hence, we adopted the 1:3 stoichiometry (Na+–3HCO3−).
4. Estimation of cellular HCO3−, Na+ and Ca2+ activity
The following procedures were used to convert Ca2+ to Na+, Na+ to HCO3−, and HCO3− to pH.
Nai = 10Vbl/(3 x 59.157) × (Cai/Cao)1/3 × Nao
HCO3i = 10(2/3)x16.9042 x 5 × (Na0/Nai)1/3 × HCO3o
[HCO3−](mM) = 25.1 × pCO2 (mmHg)/[H+] (nM).
We adopted γHCO3 = 0.82, γNa = 0.82, and γCa = 0.38, and a Na+–HCO3− stoichiometry of 1:3.
Cable analysis
Cable analysis (Guggino at al., 1982) was used to determine the resistance of the basolateral membrane (Rbl), apical membrane (Ra), and paracellular shunt pathway (Rs) in doubly perfused bullfrog kidneys in situ.
The cellular cable was used to estimate V0 and γc, with the equation:
ΔVbl=V0 exp(−X/λc)(9)
Rz free-flow = ρc×λc2/d(10)
The luminal cable was used to estimate V0 andλl with the equation:
ΔVte=V0 exp(−X/λ1)(11)
The voltage divider ratio (Ra/Rbl) was measured experimentally.
The value of the cell cable specific resistance, γc, was used to indicate the openness of gap junctions. ρc (Ωcm) was calculated using the following equation:
ρc = (4πa0dV0/I0/λc)(12)
where λ c is the length constant of the cellular cable, V0 is an empirical intercept for X = 0, I0 is the input current, a0 is the tubule radius, and d is the thickness of the cell layer.
Statistics
Values are expressed as means ± SE, with the number of observations, n. Statistical analysis was conducted using Student’s paired t-test. Results with a p-value less than 0.05 were considered significant. In the Tables and Figures, significance is indicated as follows: *p < 0.05, **p < 0.02, ***p < 0.01, ****p < 0.005, and *****p < 0.001.
Results
1. Control conditions
With the Ca ion–selective double-barreled microelectrodes, we obtained the results shown in Table 2.
In controls, cellular pH (pHi) was 7.33 ± 0.032 (mean ± SE, n = 7) and aCai was 249.6 ± 35.54 nM (n = 28). Using the single Ca ion–selective microelectrode with conventional microelectrodes impaled into tubular cells in the neighborhood, we obtained the following results: basolateral membrane PD (Vbl) was 54.3 ± 1.89 mV (n = 11), and aCai was 340.4 ± 71.3 nM (n = 11). The actual trace of the output of the reference barrel (Vbl) and the differential output (VCa-Vbl) of the Ca ion–selective barrel of the Ca-selective double-barreled microelectrodes are shown in Fig. 3. In another impalement study, cellular pH was monitored with H ion–selective LIX double-barreled microelectrodes. Results are shown in Fig. 3 (actual trace) and in Table 2.
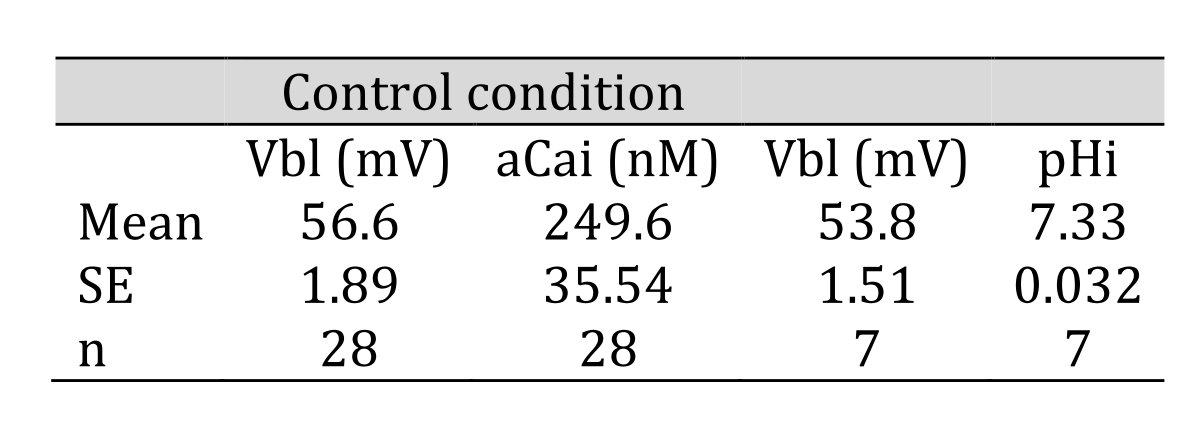
Table 2: Control condition. aCai was 249.6 nM and pHi was 7.33. n: number of samples. Data are shown as means ± standard error (SE). (paired sample)
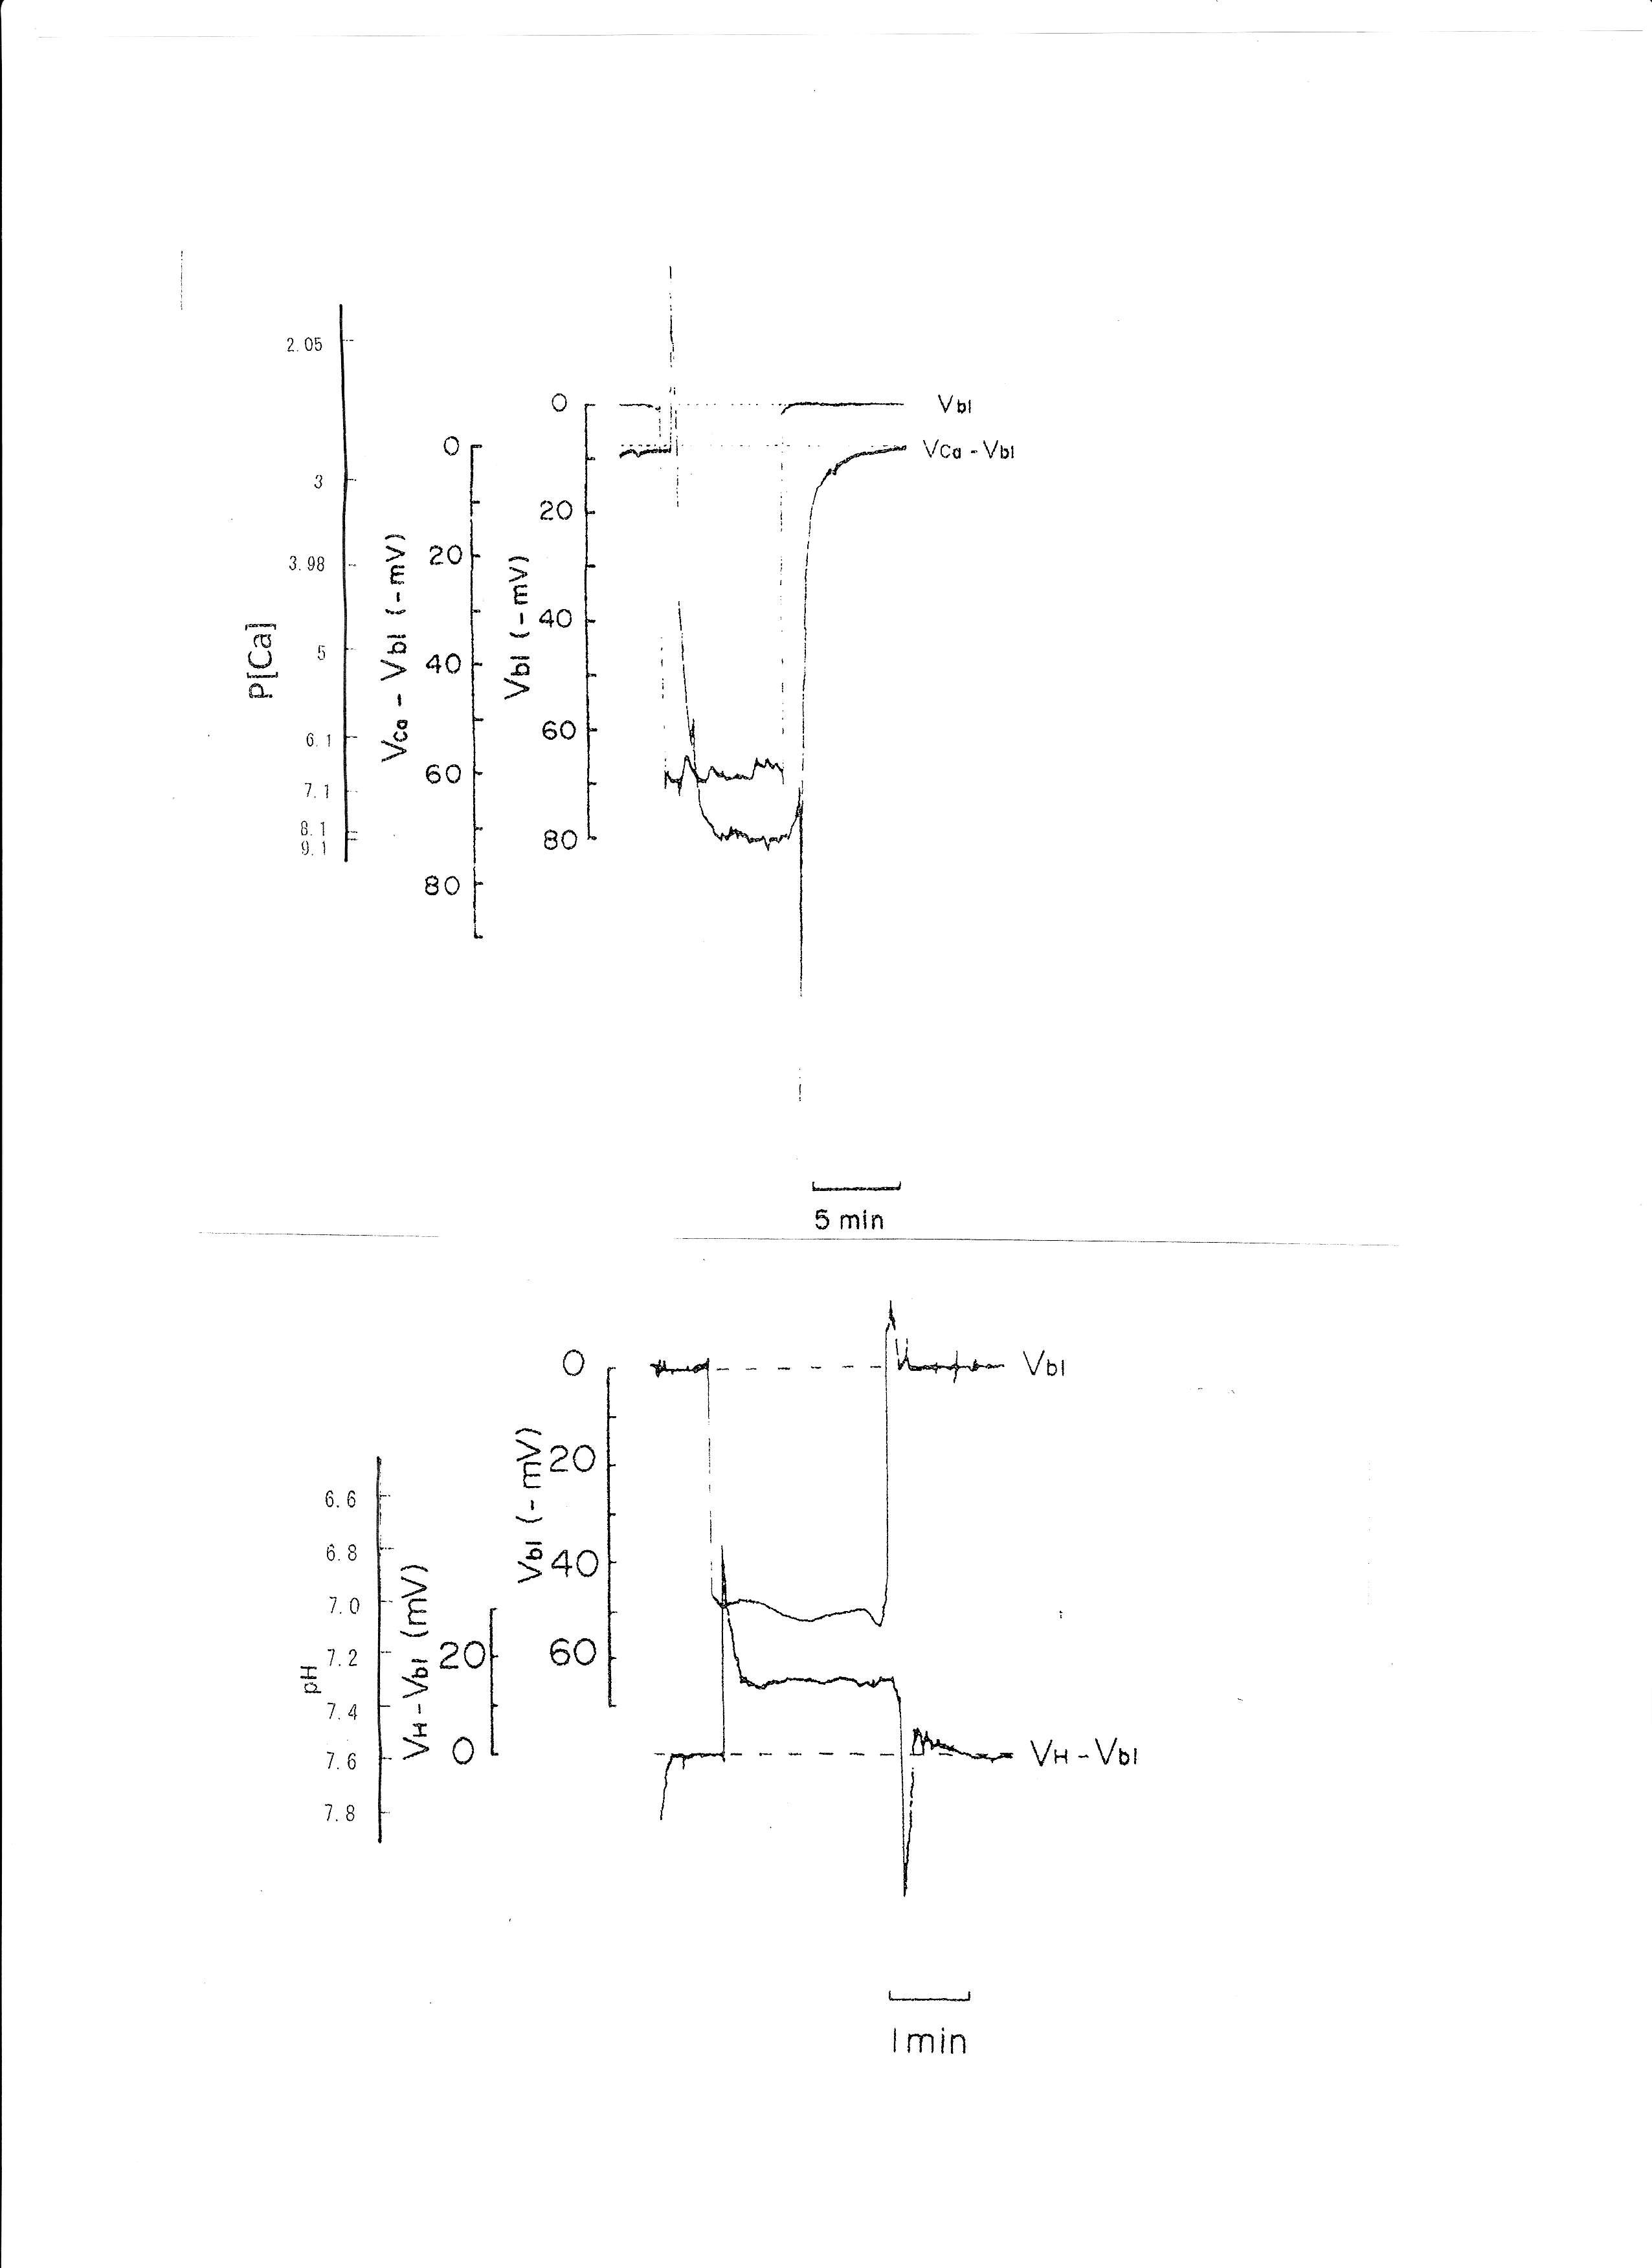
Fig. 3: Actual trace of the output of the reference barrel (Vbl) and the differential output (VCa-Vbl) of the Ca ion–selective barrel of the Ca-selective double-barreled microelectrodes. Actual trace of the output of the reference barrel (Vbl) and the differential output (VH- Vbl) of the H ion–selective barrel of the H ion–selective LIX (liquid ion exchanger) double-barreled microelectrodes. The doubled-barreled Ca2+-selective microelectrode’s pCa scale is non-linear. Surface Ca2+ and surface pH refer to the Ca2+ activity and pH of Ringer solution, respectively.
2. Transient respiratory acidosis (from 1.5% CO2 to 5% CO2 with constant 15 mM HCO3)
The pH of the solution was changed from 7.6 to 7.2. The luminal perfusate was kept unchanged. The results are shown in Table 3 and Fig. 4 (actual trace). Acid loading by means of PCO2 caused cell acidosis, but little change of aCai with minimal depolarization.
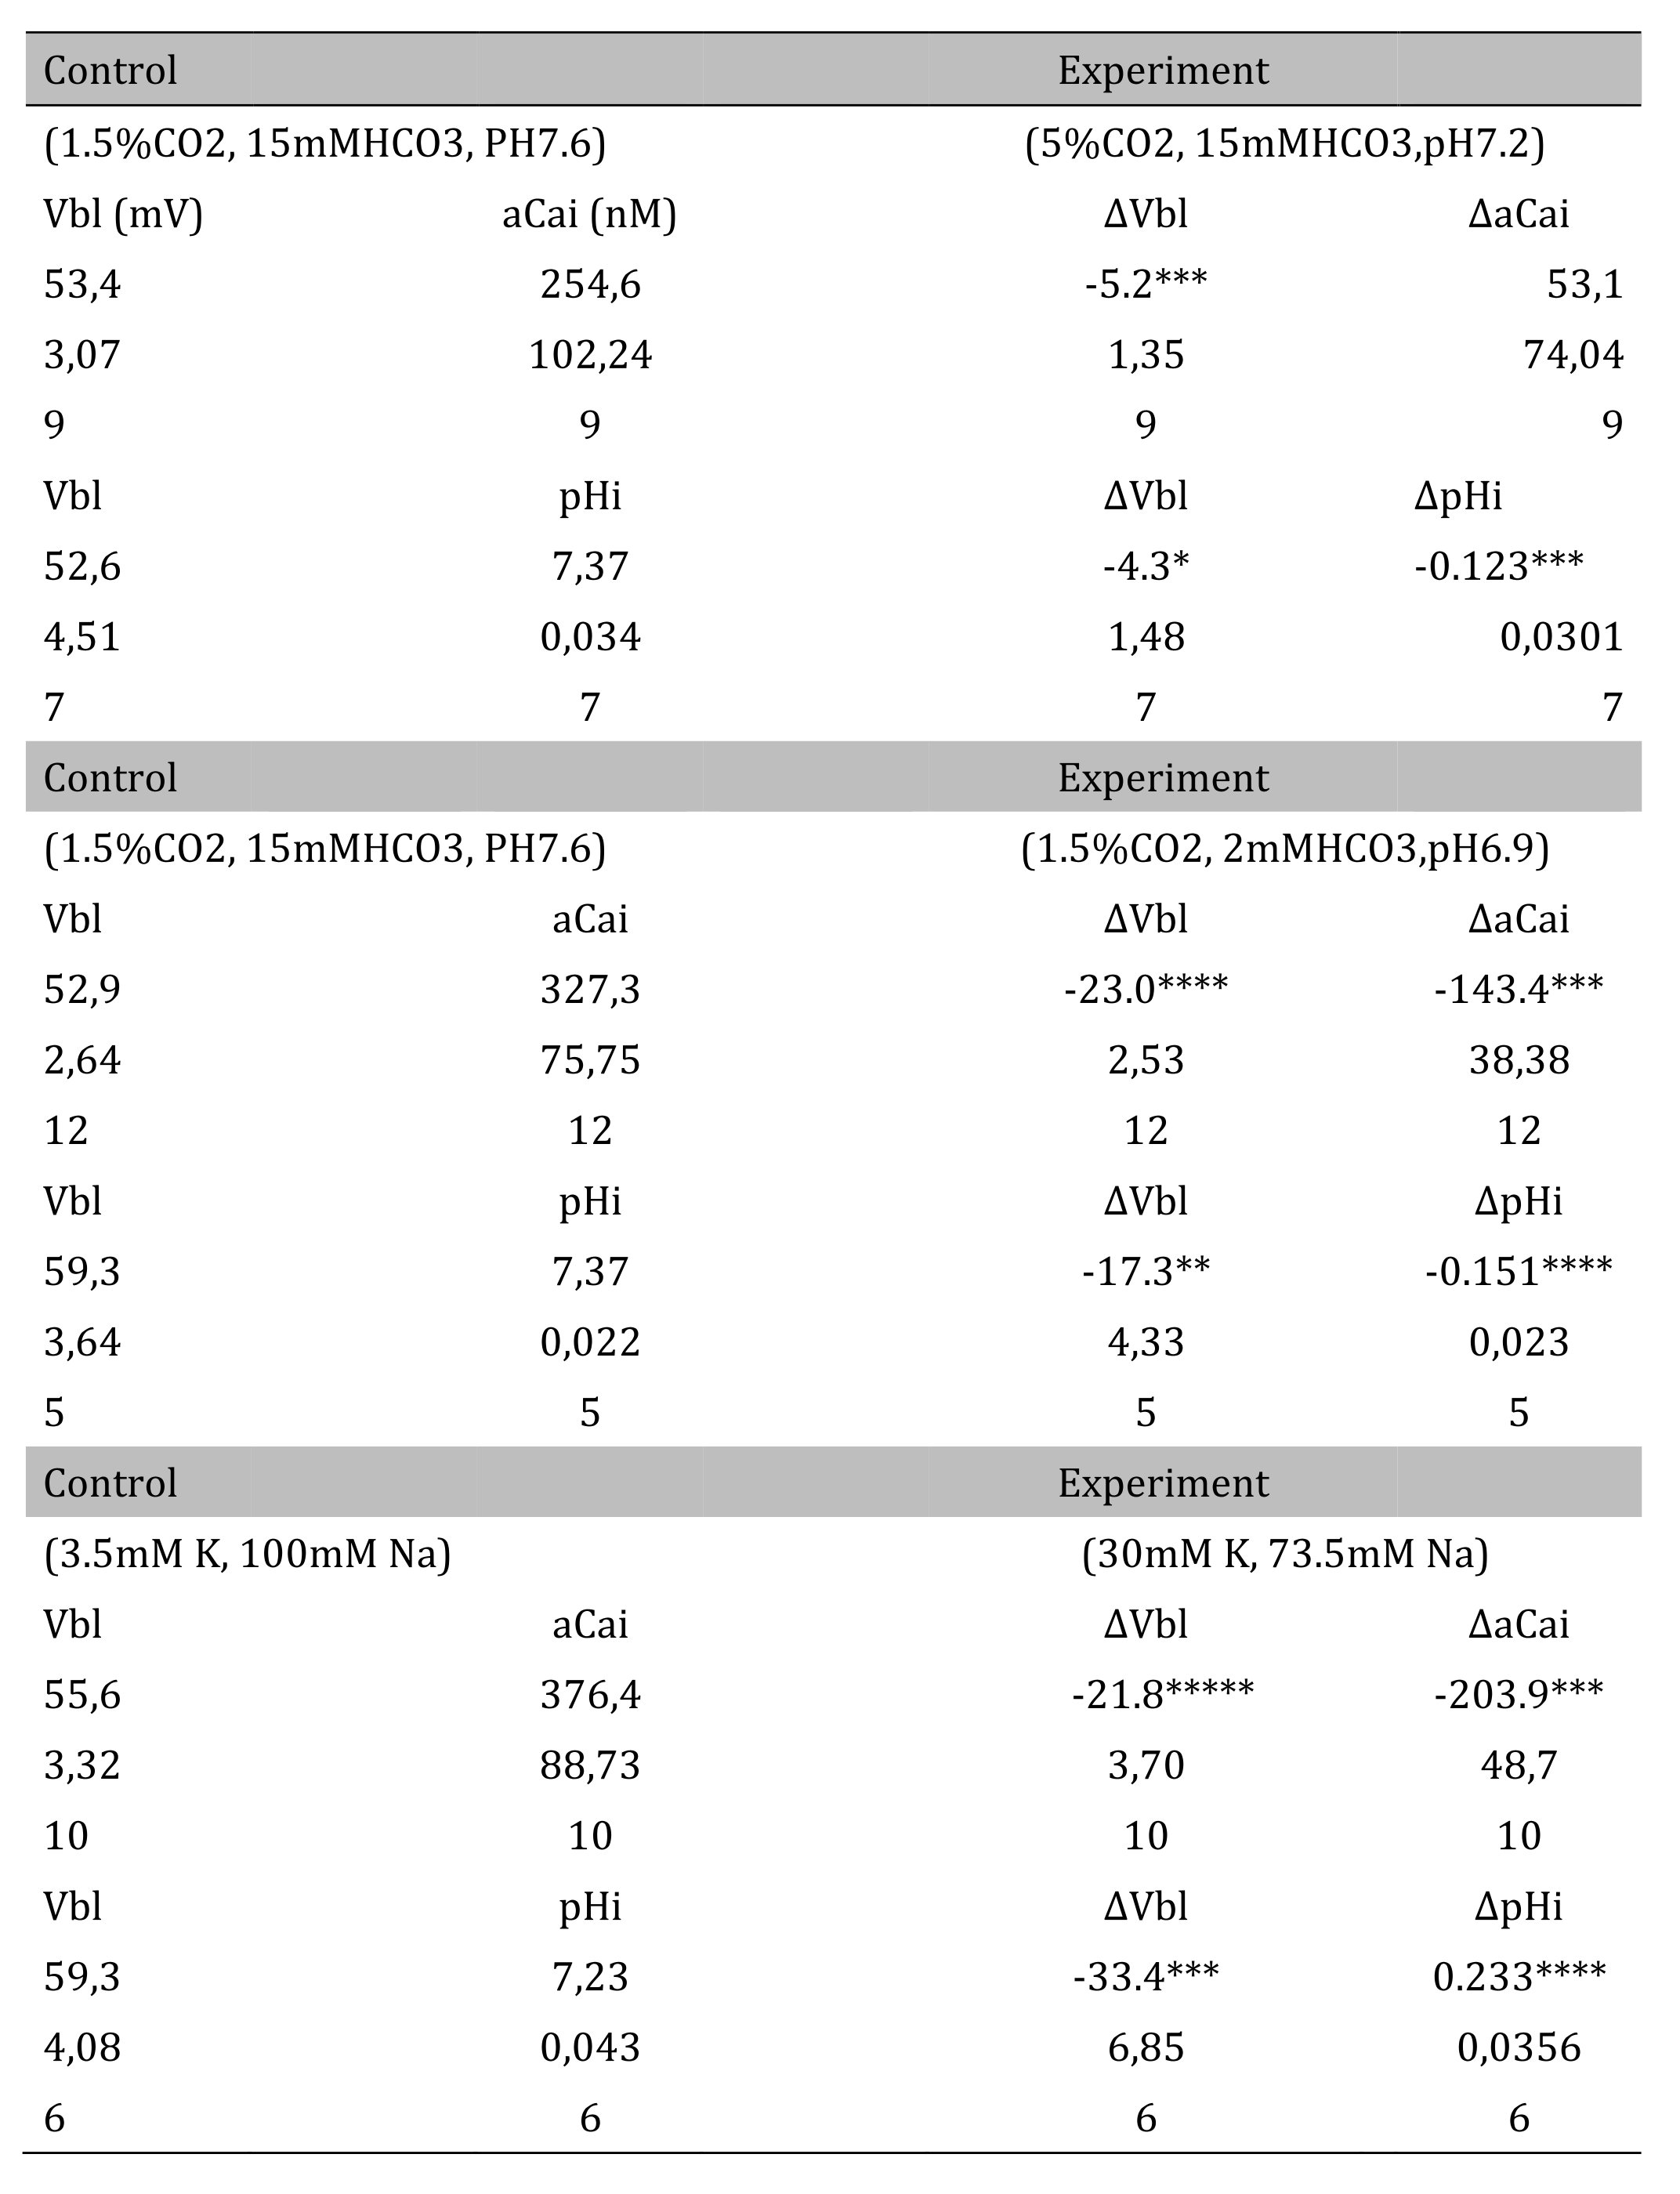
Table 3: Respiratory acidosis. Vbl was depolarized significantly; aCai was not changed; and cellular pH was significantly decreased (*p < 0.05, ***p < 0.01). Δ means experimental value - control value at single experiment (paired samples). Metabolic acidosis. Vbl was depolarized significantly; aCai was decreased significantly; and pH was significantly decreased (**p < 0.02, ***p < 0.01, ****p < 0.005). 30 mM K solution. Vbl was depolarized significantly; aCai was decreased significantly; and pH was significantly increased ( ***p < 0.01, ****p < 0.005, *****p < 0.001)
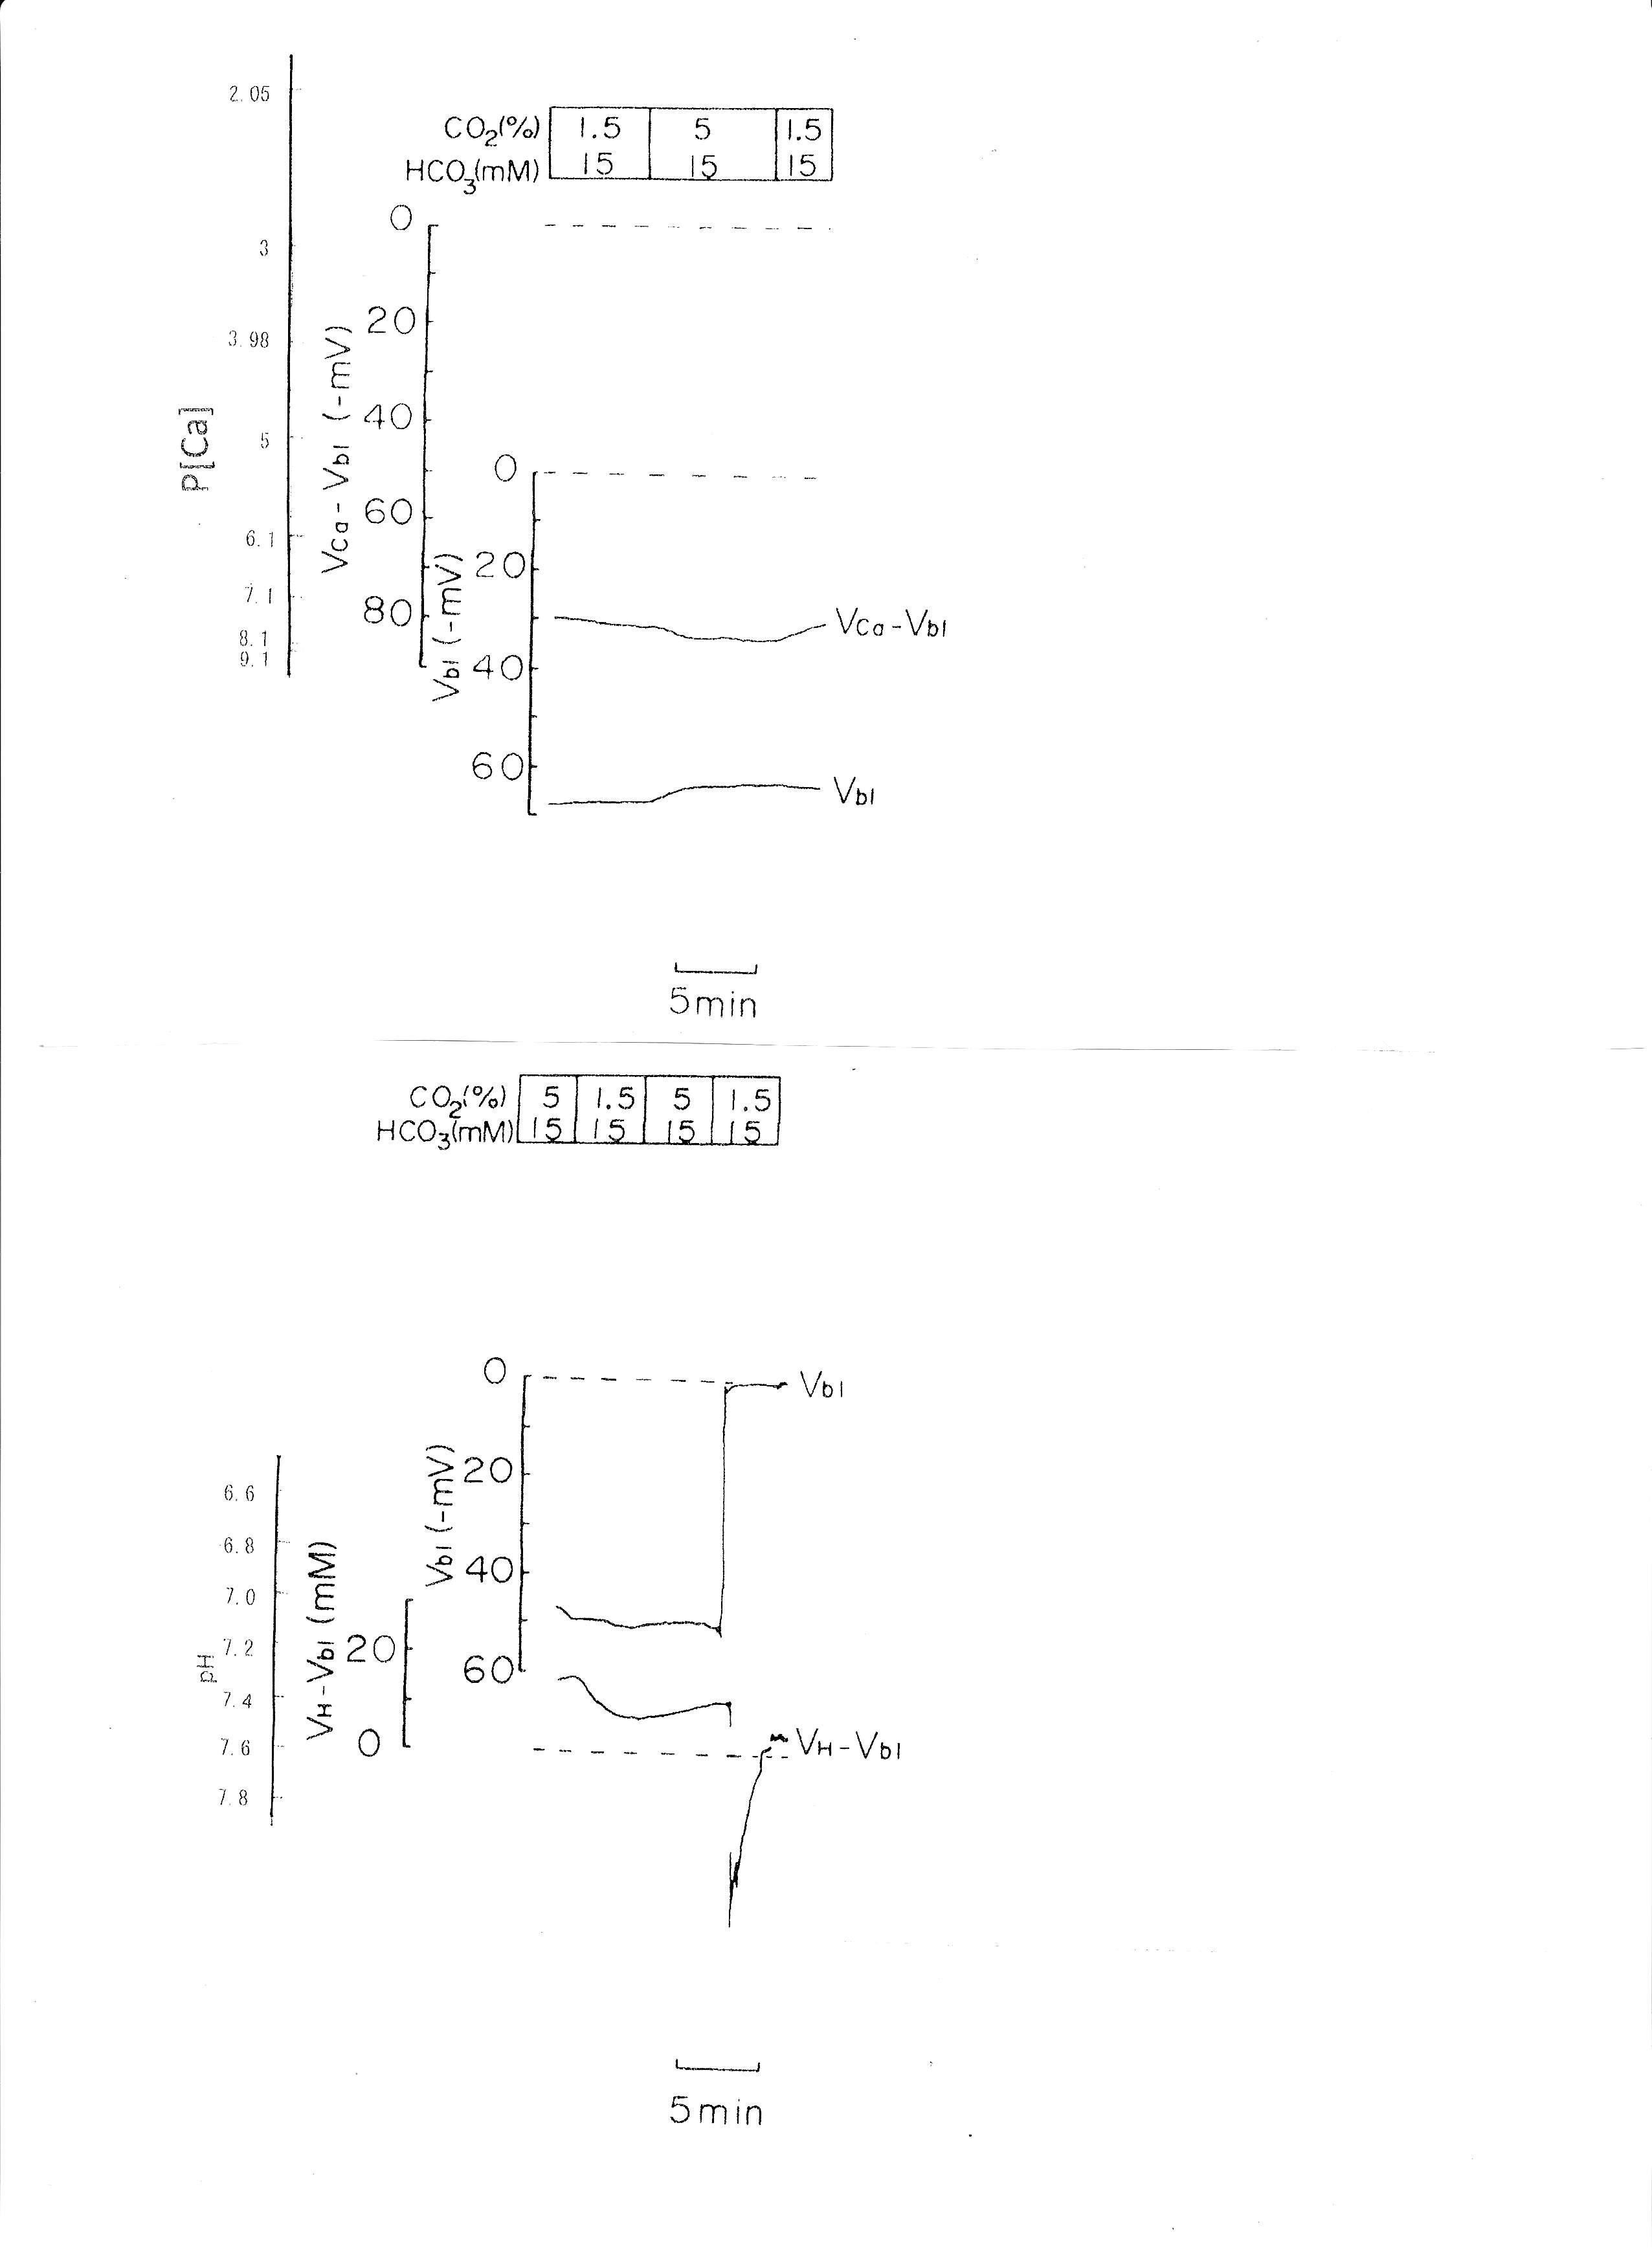
Fig. 4: Respiratory acidosis. Actual trace of Vbl and VCa-Vbl of the Ca ion–selective double-barreled microelectrode. Actual trace of Vbl and VH-Vbl of the H-selective double-barreled microelectrode.
3. Transient metabolic acidosis (from 15mM HCO3 to 2mM HCO3 with constant 1.5% CO2).
The pH of the solution was changed from 7.6 to 6.9. The results are shown in Table 3. Actual traces are shown in Fig. 5. Acid loading by means of HCO3 removal caused cell acidosis with large depolarization and decreases in aCai.
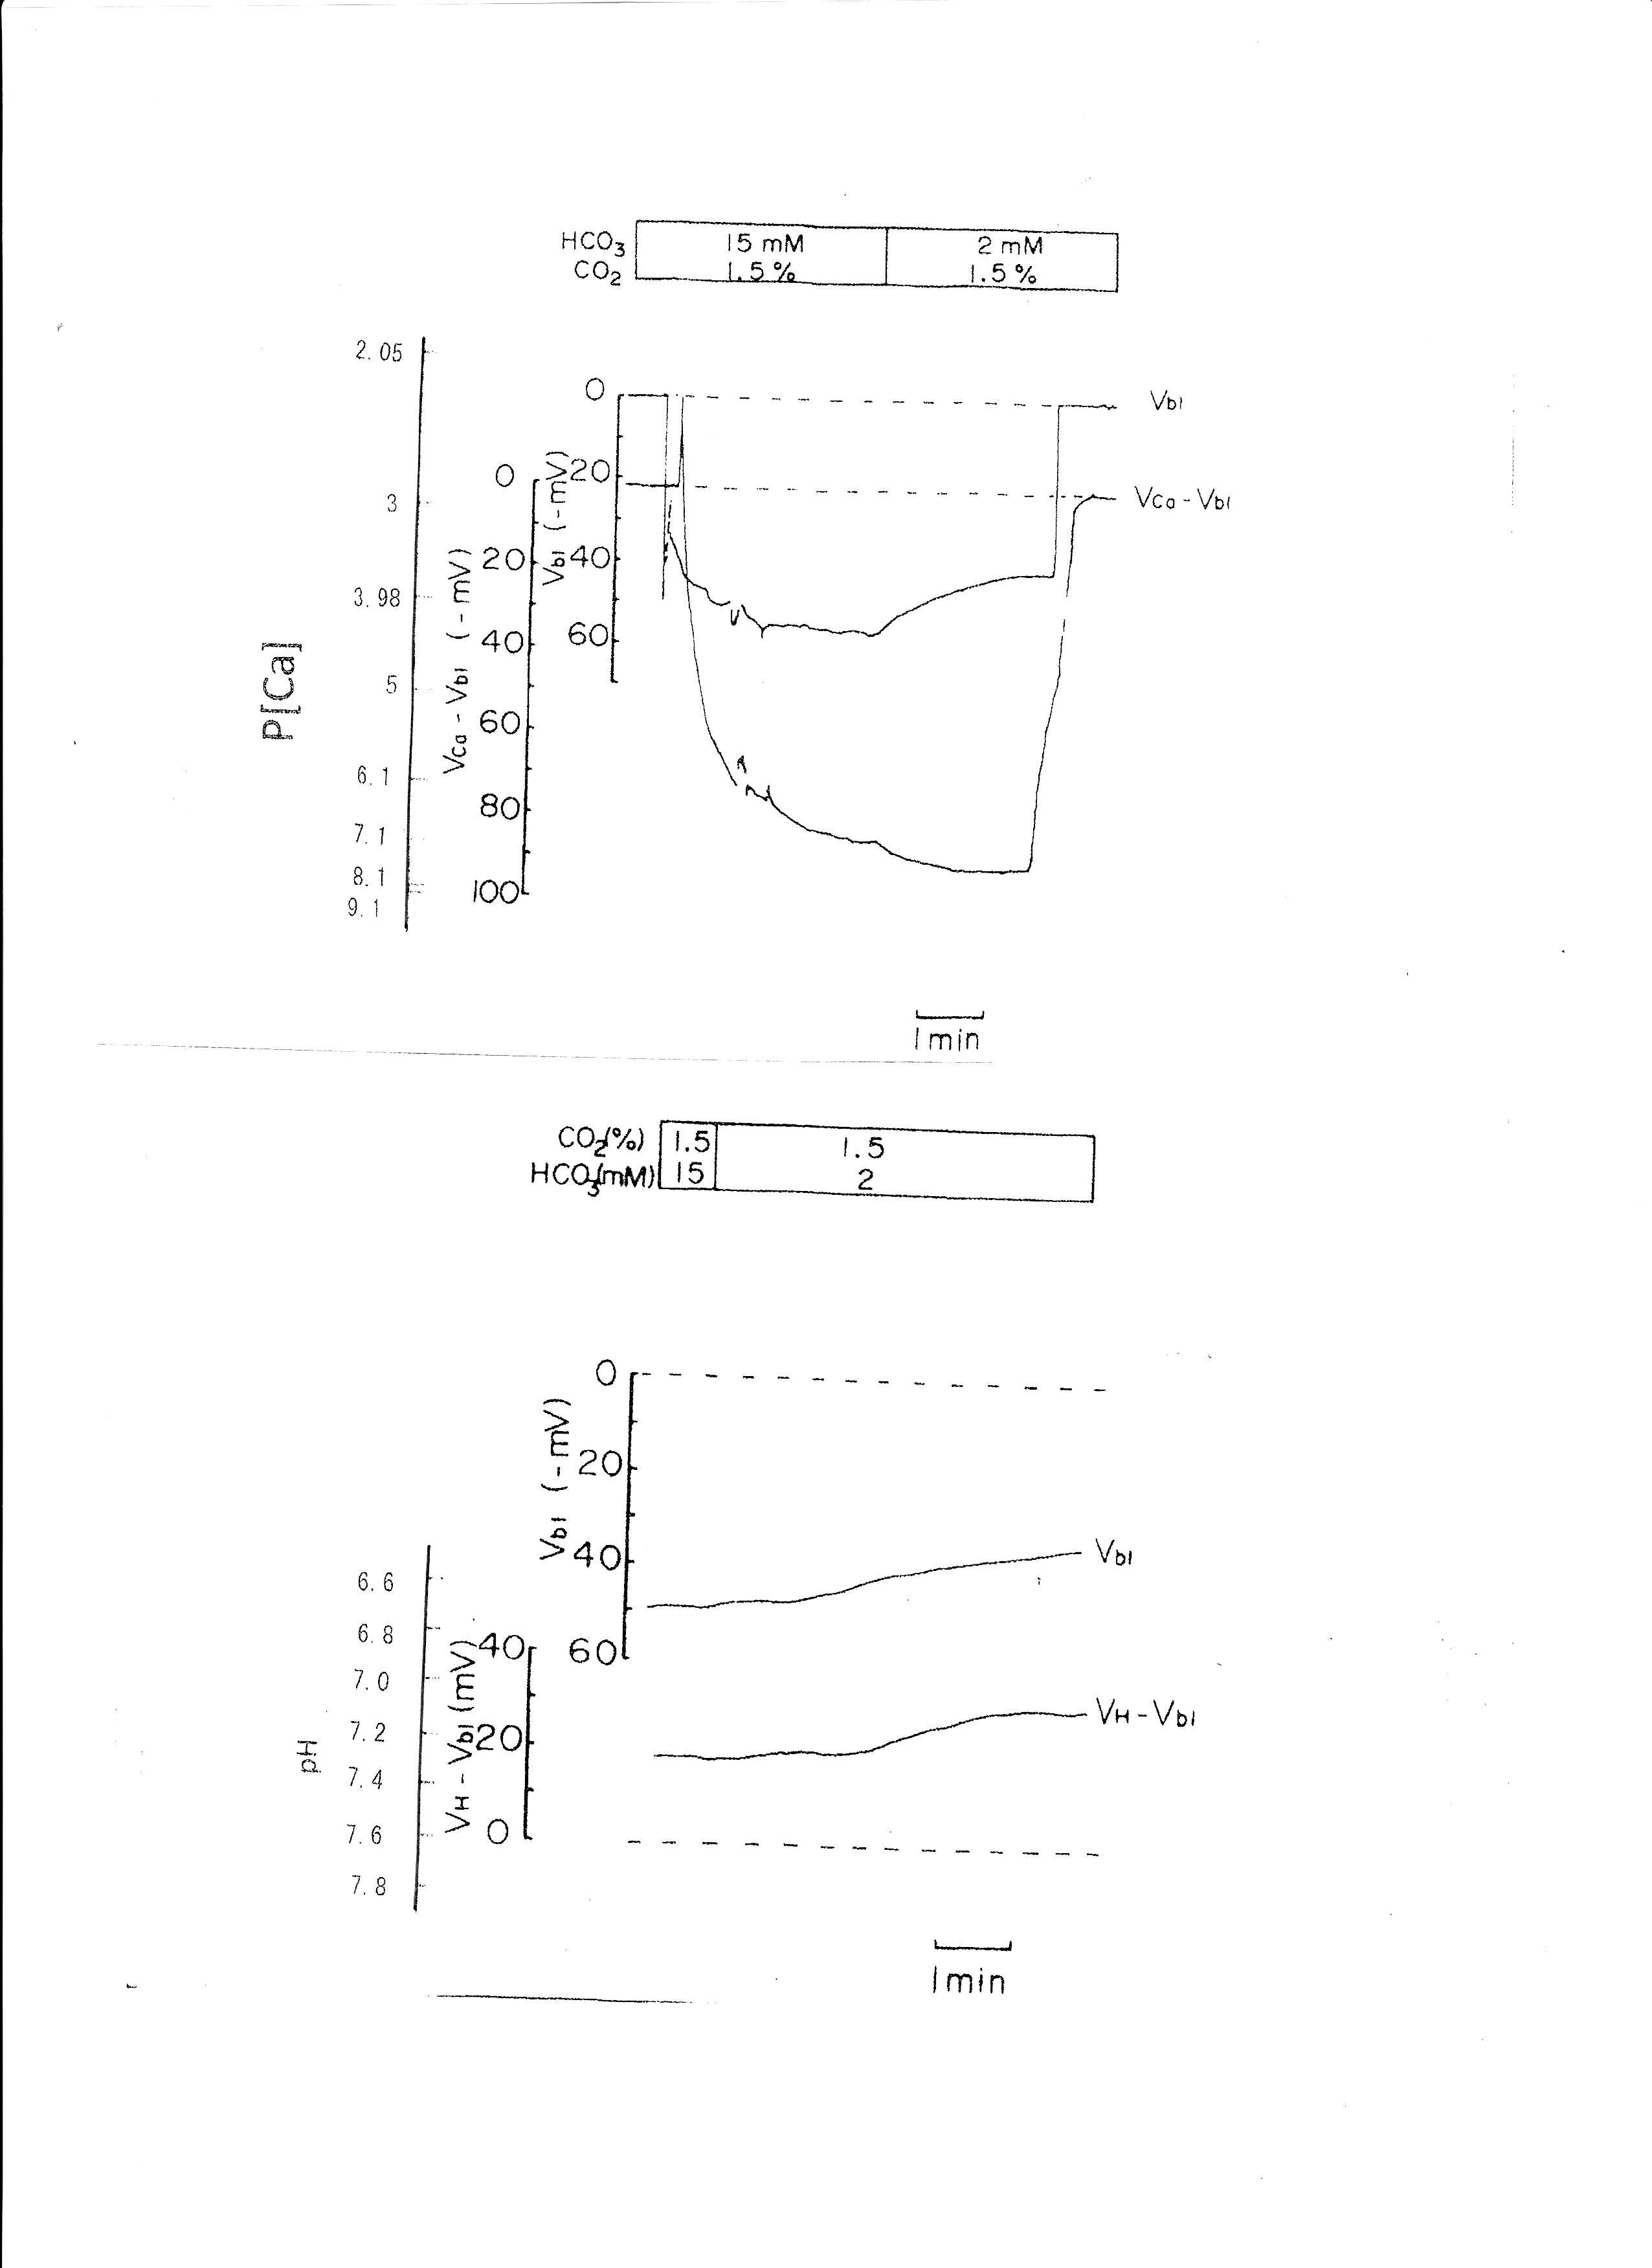
Fig. 5: Metabolic acidosis. Actual trace of Vbl and VCa-Vbl of the Ca ion–selective double-barreled microelectrode. Actual trace of Vbl and VH-Vbl of the H-selective double-barreled microelectrode.
4. Transient 30 mM K solution (from 3.5 mM to 30 mM K)
The peritubular perfusate was changed from 3.5 mM to 30 mM K. Na was reduced to maintain the osmolarity of the solution. The results are shown in Table 3. The actual traces are shown in Fig. 6. The 30 mM K peritubular solution caused a large depolarization of the basolateral membrane PD. Cell alkalinization was observed, and aCai decreased.
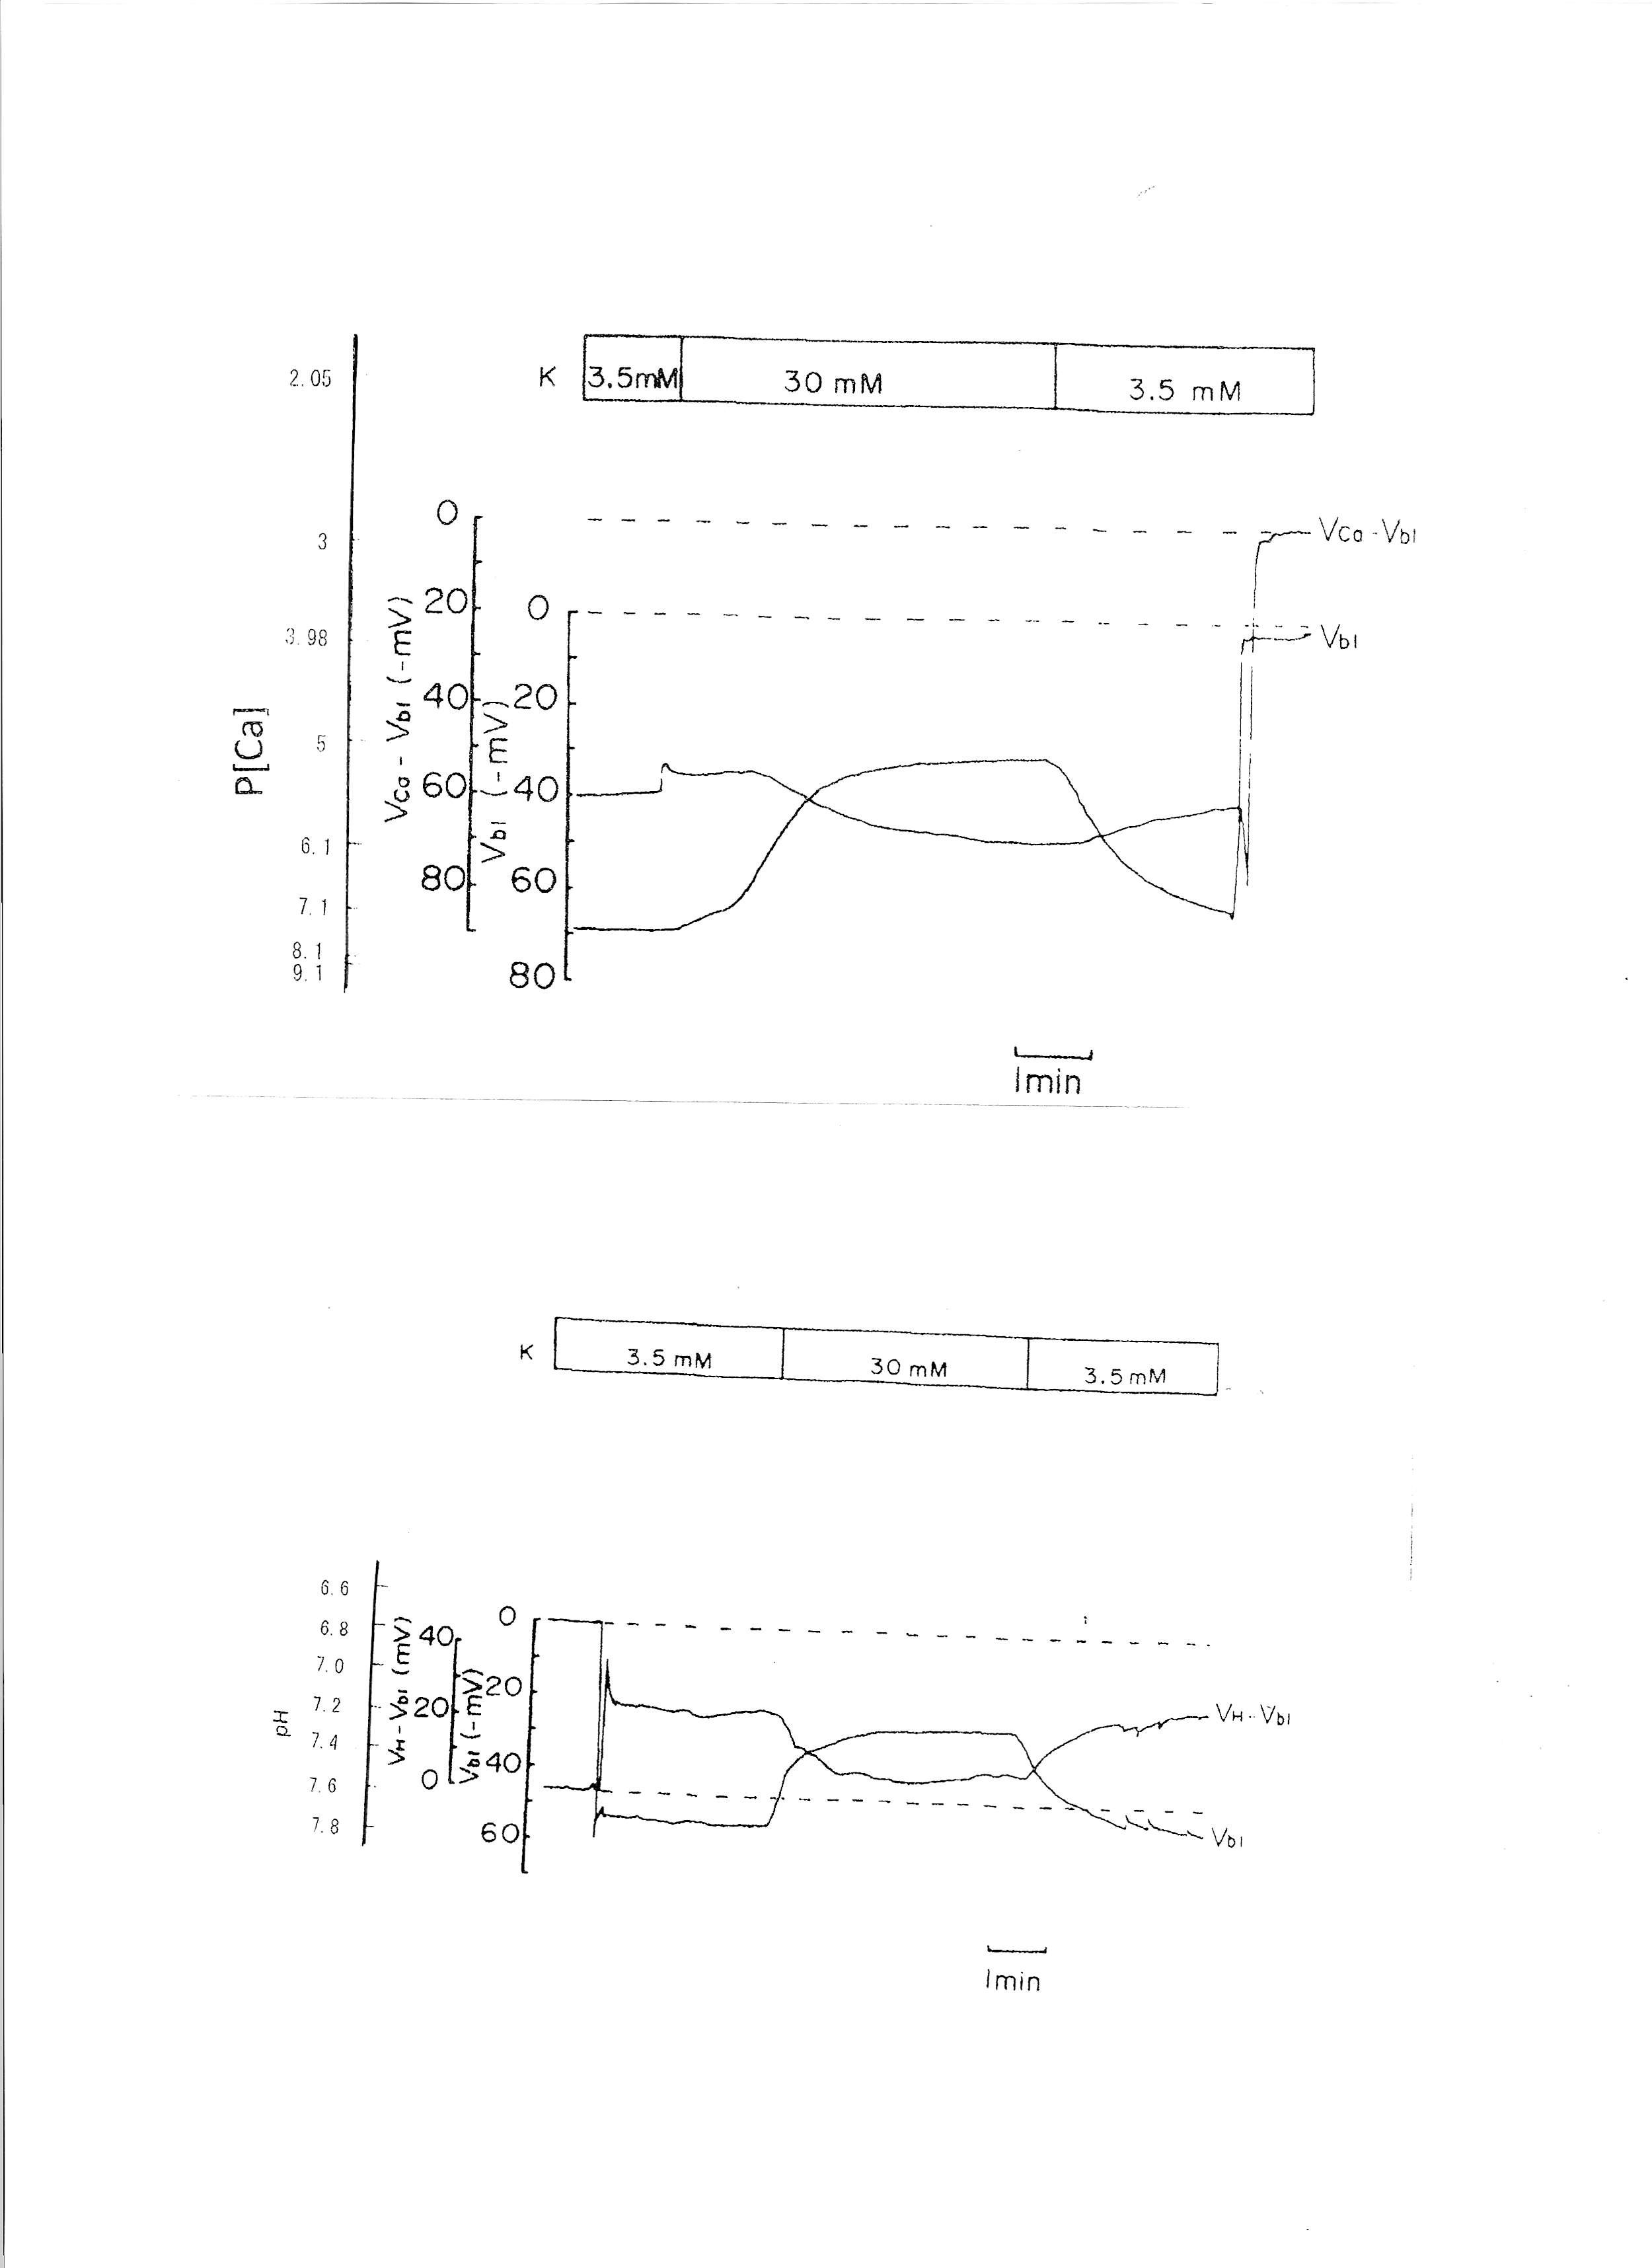
Fig. 6: 30mM K solution. Actual trace of Vbl and VCa-Vbl of the Ca ion–selective double-barreled microelectrode. Actual trace of Vbl and VH-Vbl of the H-selective double-barreled microelectrode.
5. 1.339 × 10⁻⁵ M ionomycin
Ionomycin, a Ca2+ ionophore, was applied to the peritubular perfusate. The results are shown in Table 4. The actual trace is shown in Fig. 7. Ionomycin caused an increase in aCai and cellular alkalization but did not change basolateral membrane potential significantly. Only one experiment was carried out with 2.68 × 10⁻⁵ M ionomycin. The results were as follows: Vbl was depolarized by 10 and aCai increased from 17.99 to 441.6 nM (n = 1).
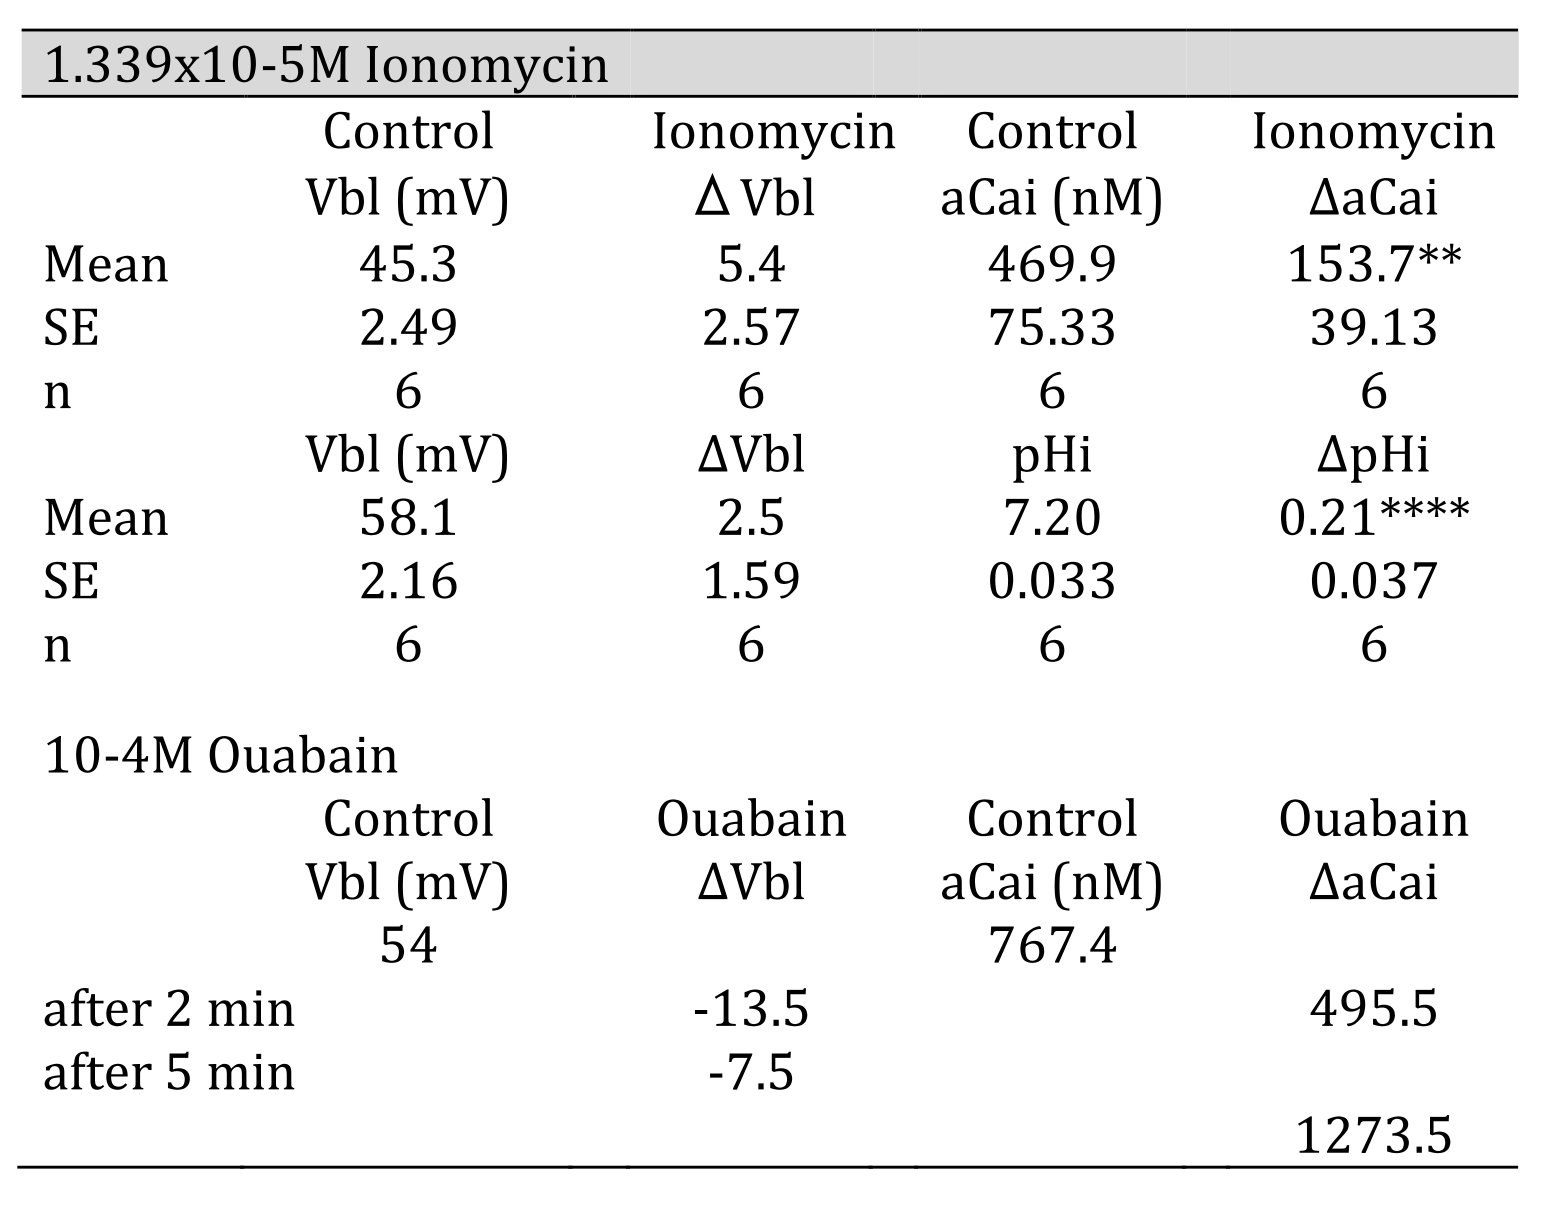
Table 4: 1.339 105 M ionomycin. Vbl was not changed. aCai increased significantly, and cellular pH was significantly increased( **p < 0.02, ****p < 0.005). 104 M ouabain. Vbl was depolarized, aCai decreased and then increased
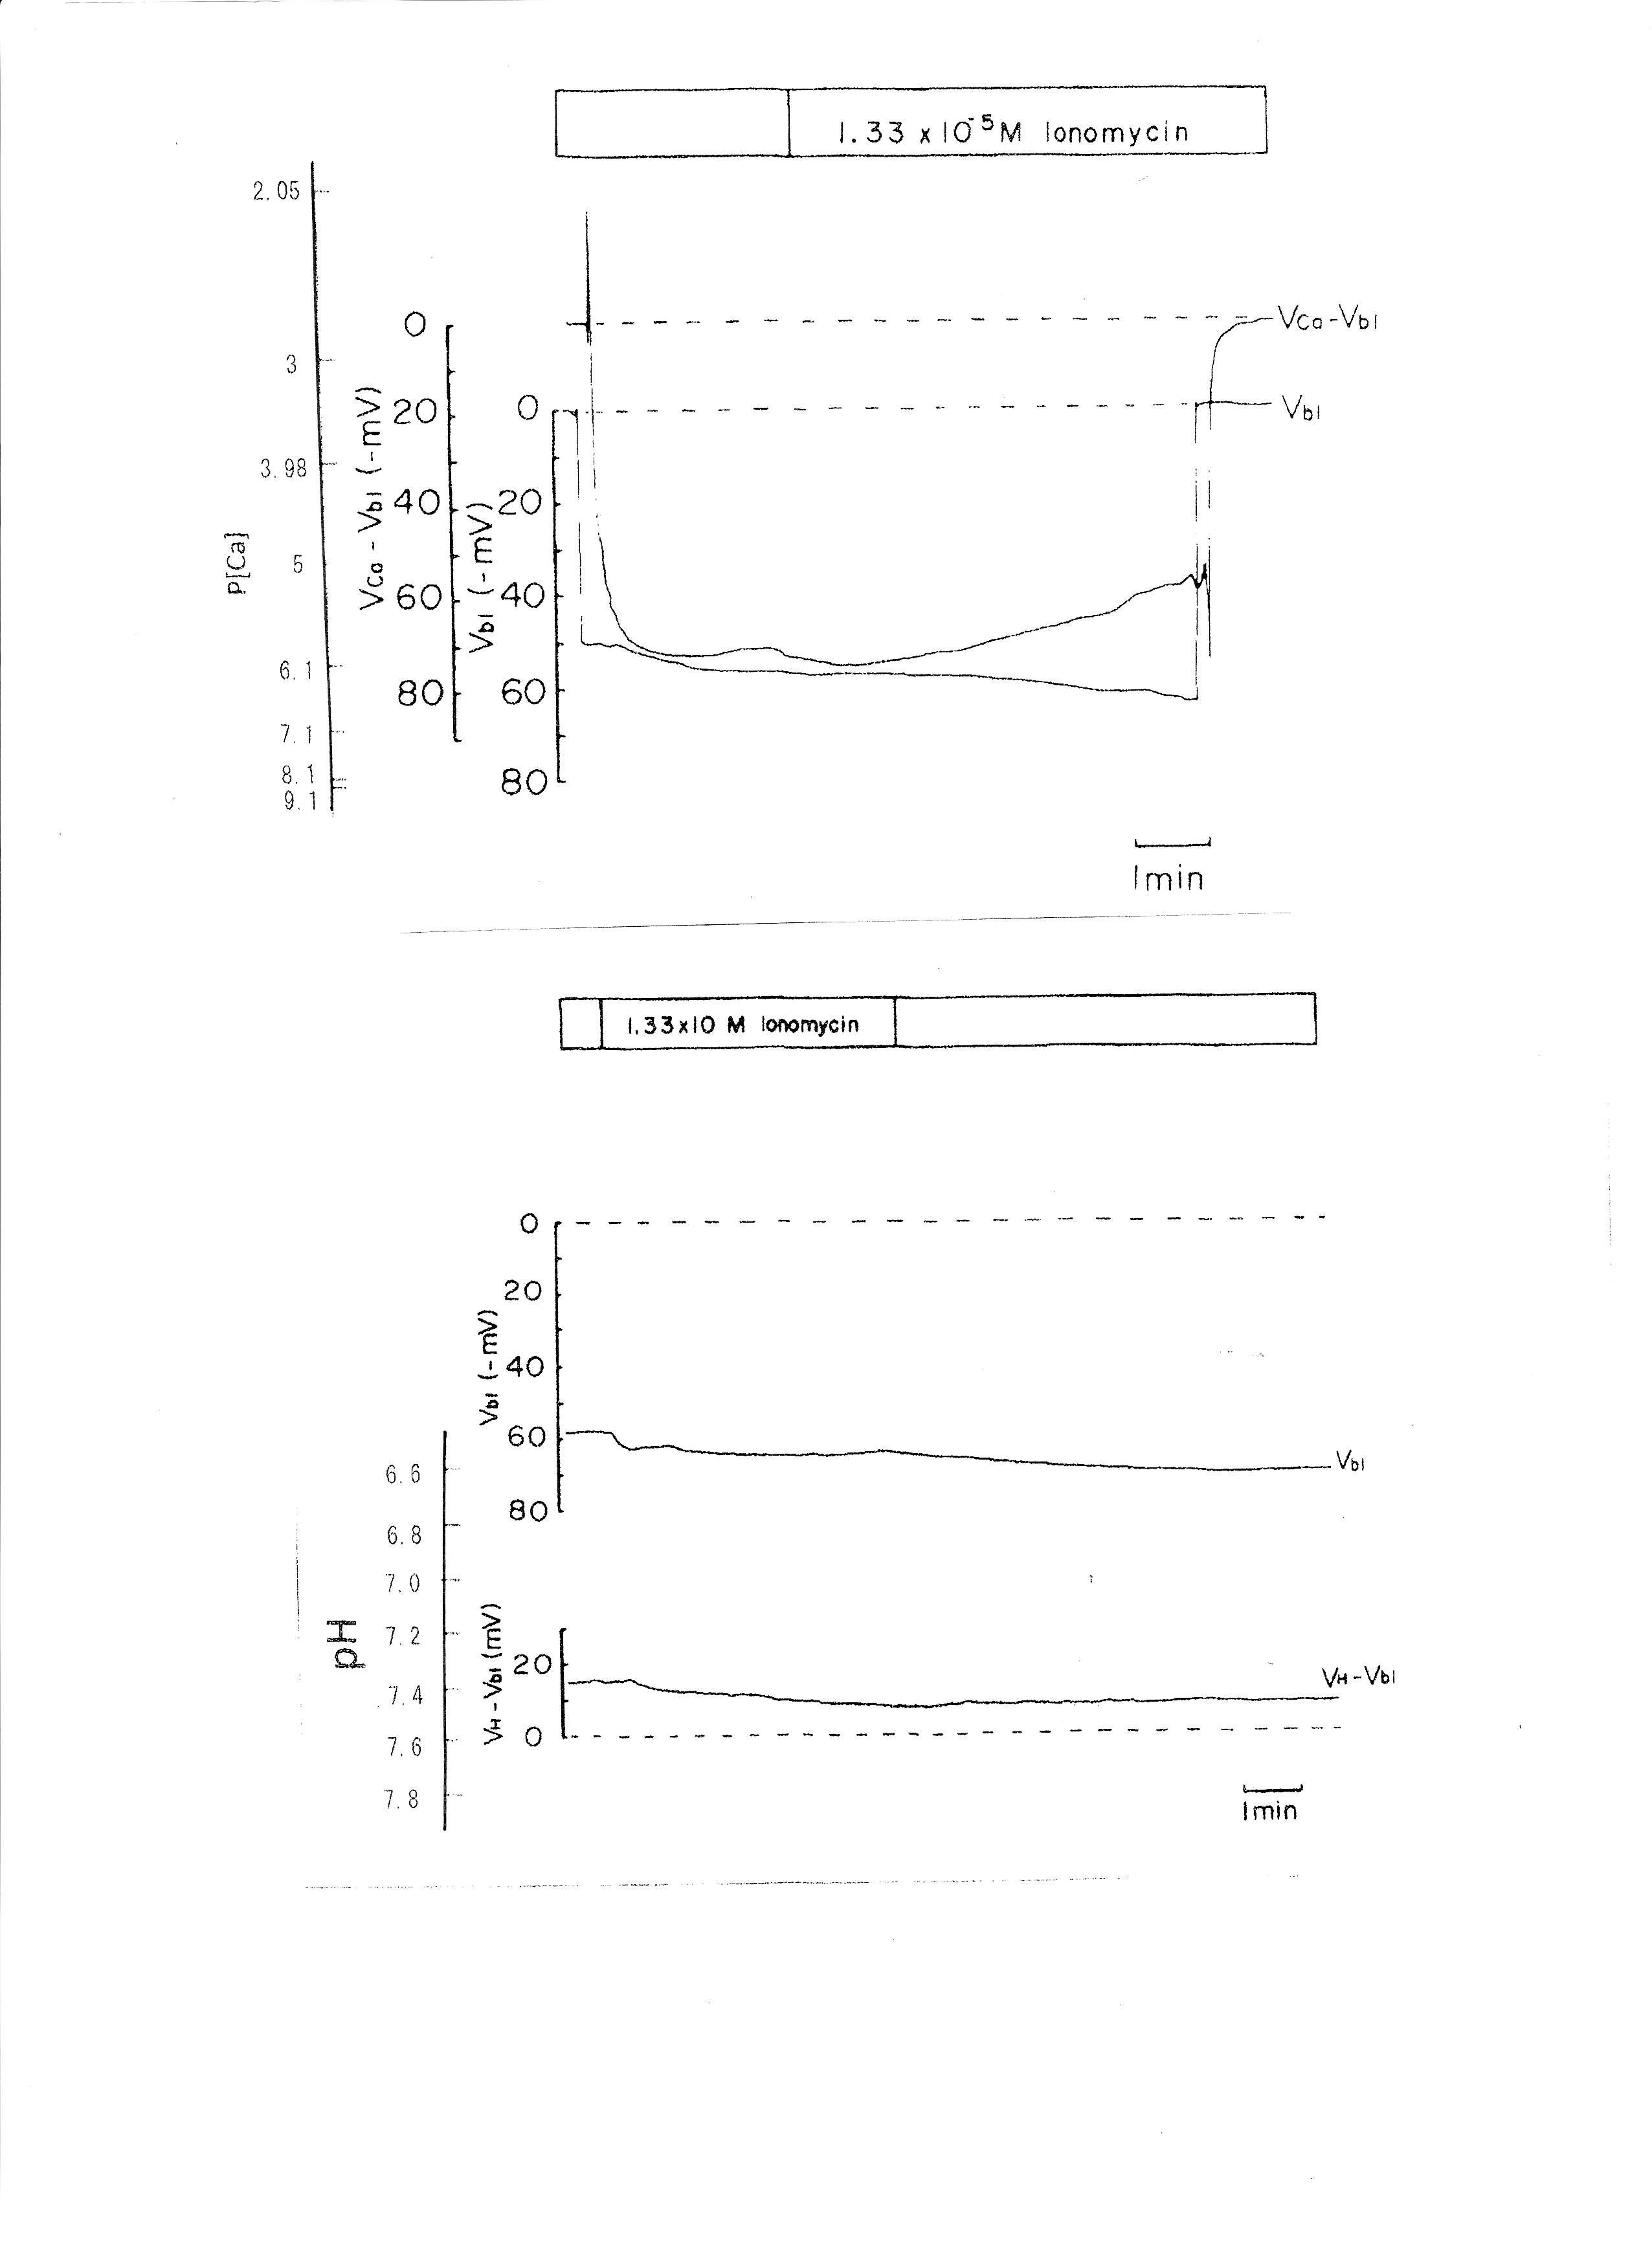
Fig. 7: The effects of 1.339 × 10⁻⁵ M ionomycin on cellular Ca activity (aCai) and cellular pH (pHi). Actual trace of Vbl and VCa-Vbl from Ca2+-selective double-barreled microelectrode. Actual trace of Vbl and VH-Vbl from H+-selective double-barreled microelectrode.
6. 10−4 M ouabain
Ouabain was applied from the peritubular side. The results obtained with the Ca2+-selective double-barreled microelectrode are shown in Table 4. The actual trace is shown in Fig. 8. Using a single Ca2+-selective LIX microelectrode and a conventional microelectrode, aCai was estimated in the presence of ouabain. aCai decreased from 1.57 to 0.7 nM with depolarization (from 51.0 to 45.6 mV) after 1.5 min. In another study, aCai decreased from 40.3 to 8.22 nM after 3 min and increased from 40.3 to 116.1 nM after 6 min. Membrane potential decreased from 77.2 to 69.1 mV after 3 min and to 63.9 mV after 6 min.
Ouabain caused depolarization of membrane potential. Shortly after exposure to 10−4 M ouabain, aCai decreased initially but subsequently increased after 6 min. Cell swelling may also have occurred. Cell acidification was observed following a 1 min application of 10−5 M ouabain (Fujimoto & Morimoto, 1986; Matsumura, Aoki & Fujimoto, 1985).
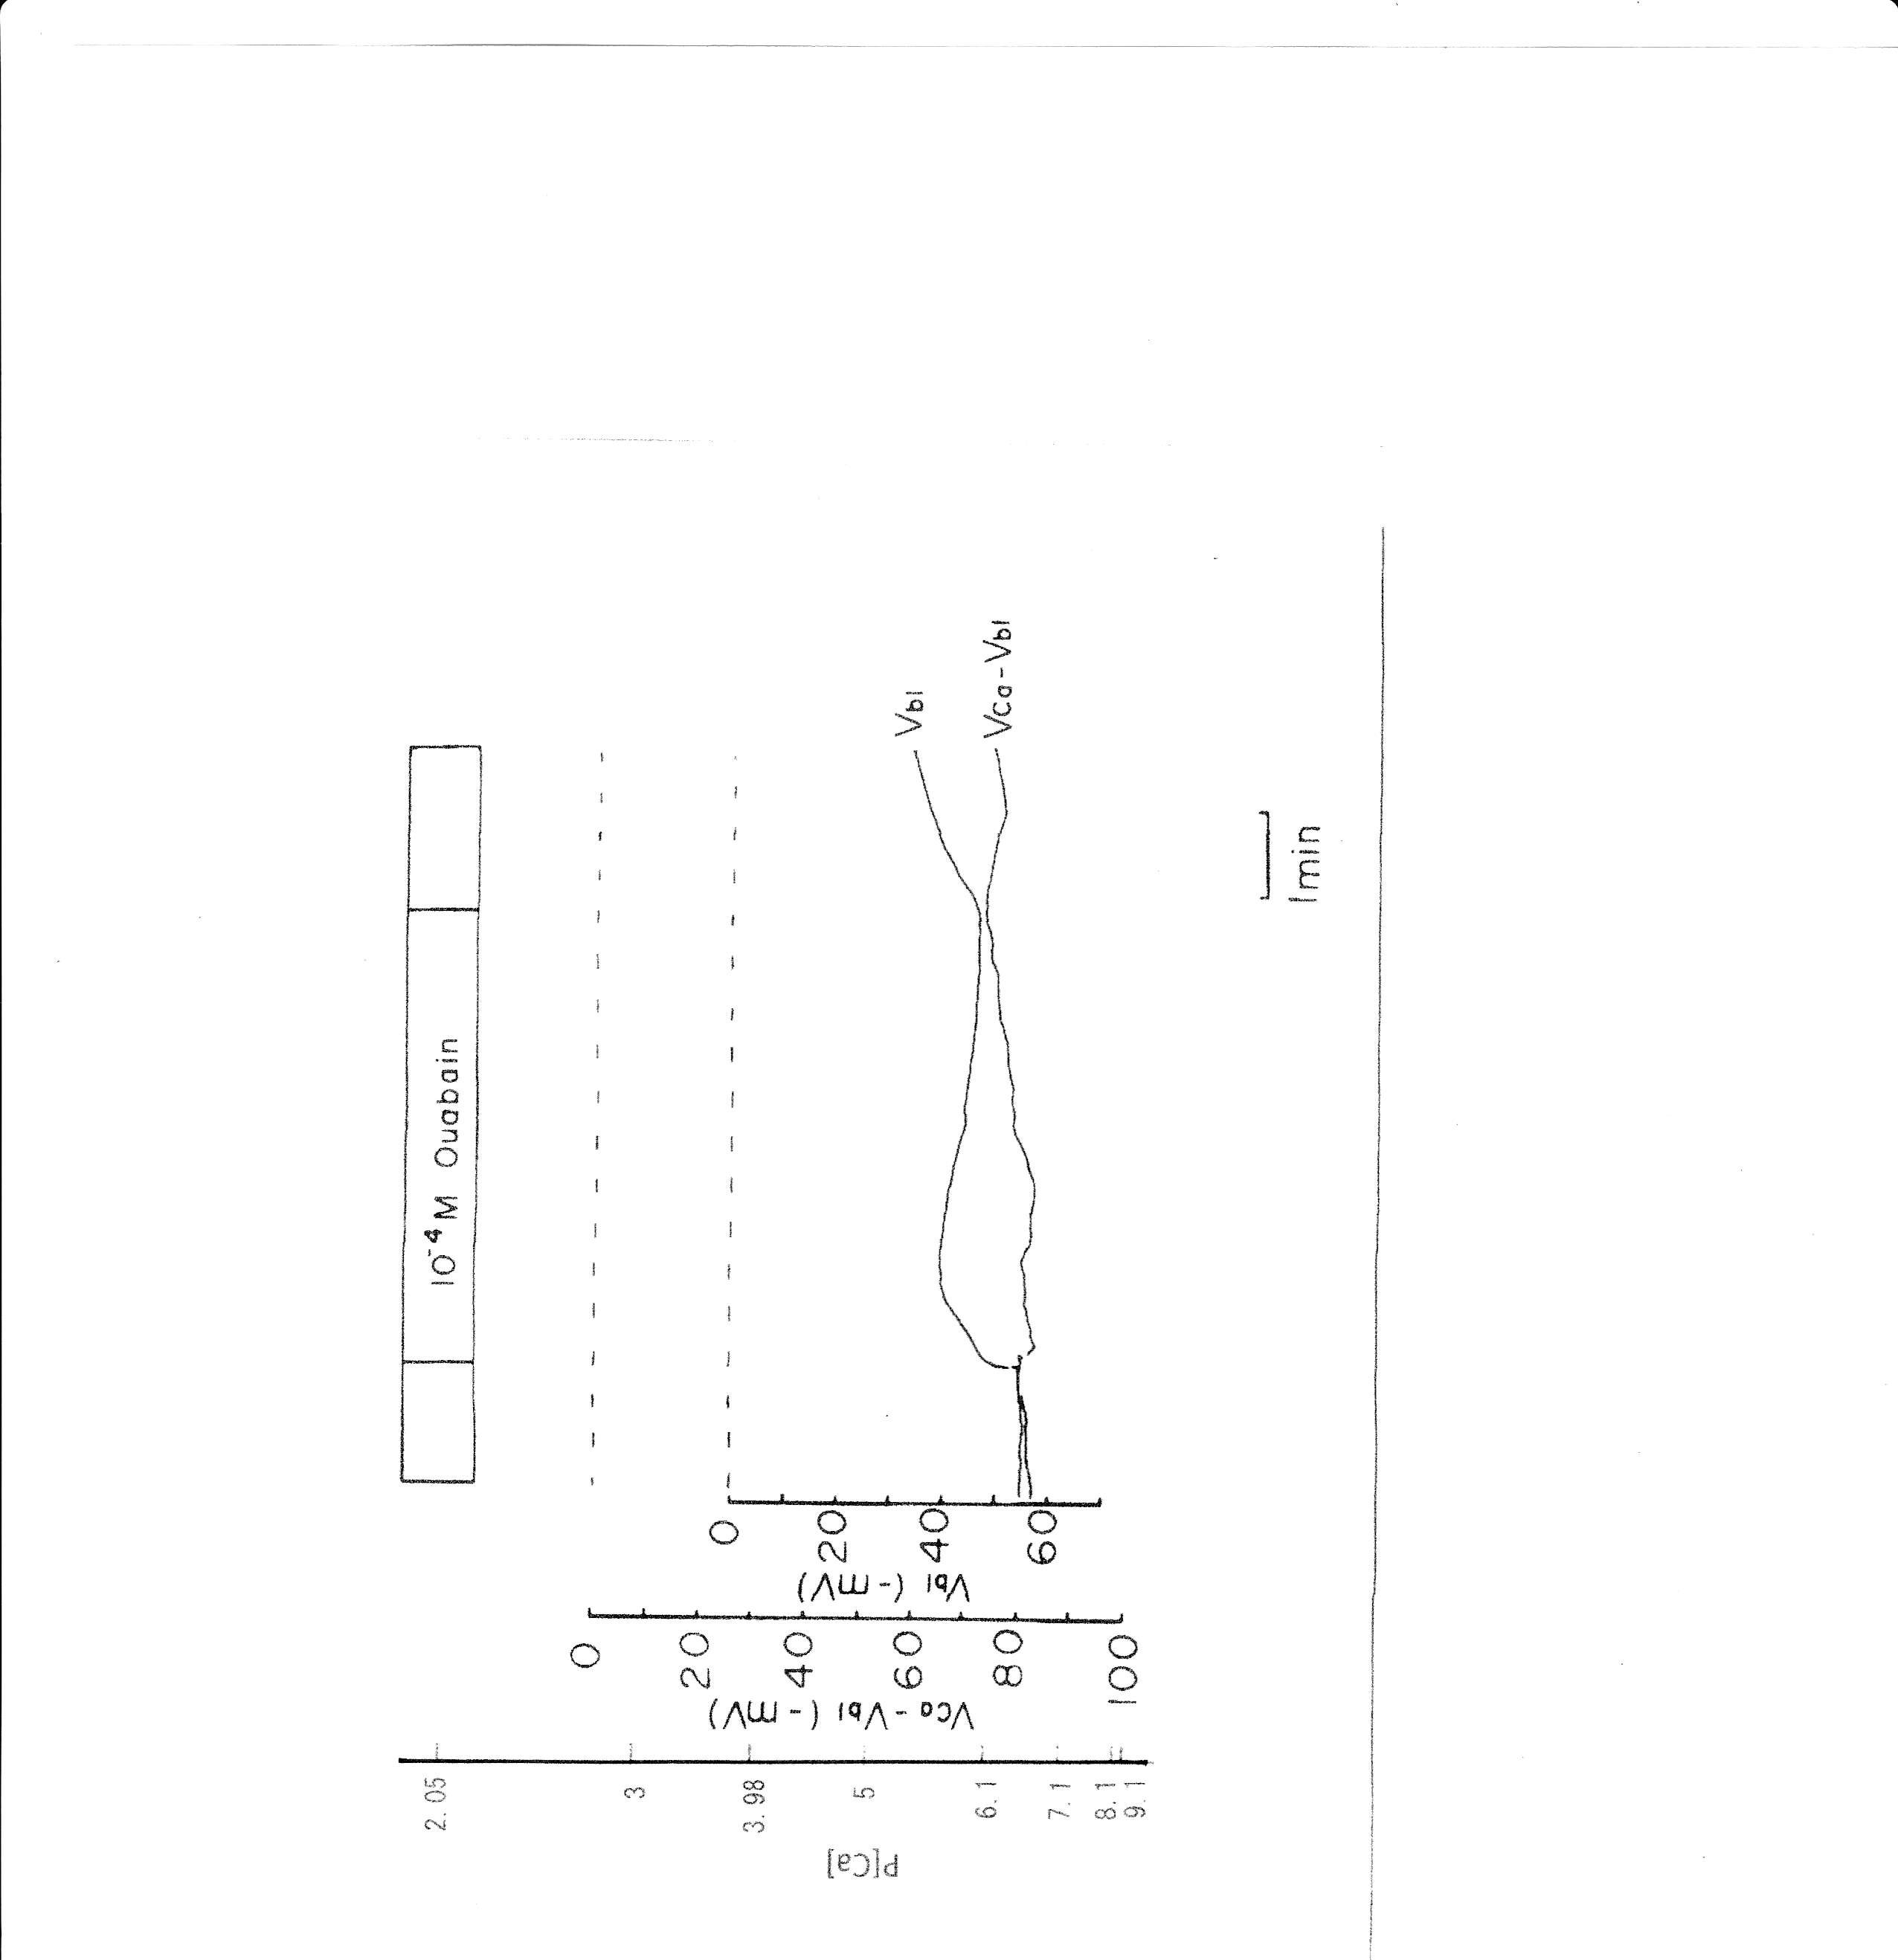
Fig. 8: 10−4 M ouabain. Actual trace of Vbl and VCa-Vbl from the Ca2+–selective double-barreled microelectrode.
7. Low Na+ (replaced with BIDAC)
BIDAC was substituted for Na+ (Thomas, 1977; Boron & Boulpaep, 1983; Oberleithner, Guggino & Giebisch, 1982). The peritubular Na+ concentration decreased from 115.5 to 0.5 mM. The results are shown in Table 5. A representative trace is shown in Fig. 9. Using a single Ca2+-selective microelectrode and a conventional microelectrode, we measured aCai. aCai decreased from 530.9 to 484.2, with −7.7 mV depolarization, 1.5 min after the change in peritubular Na.
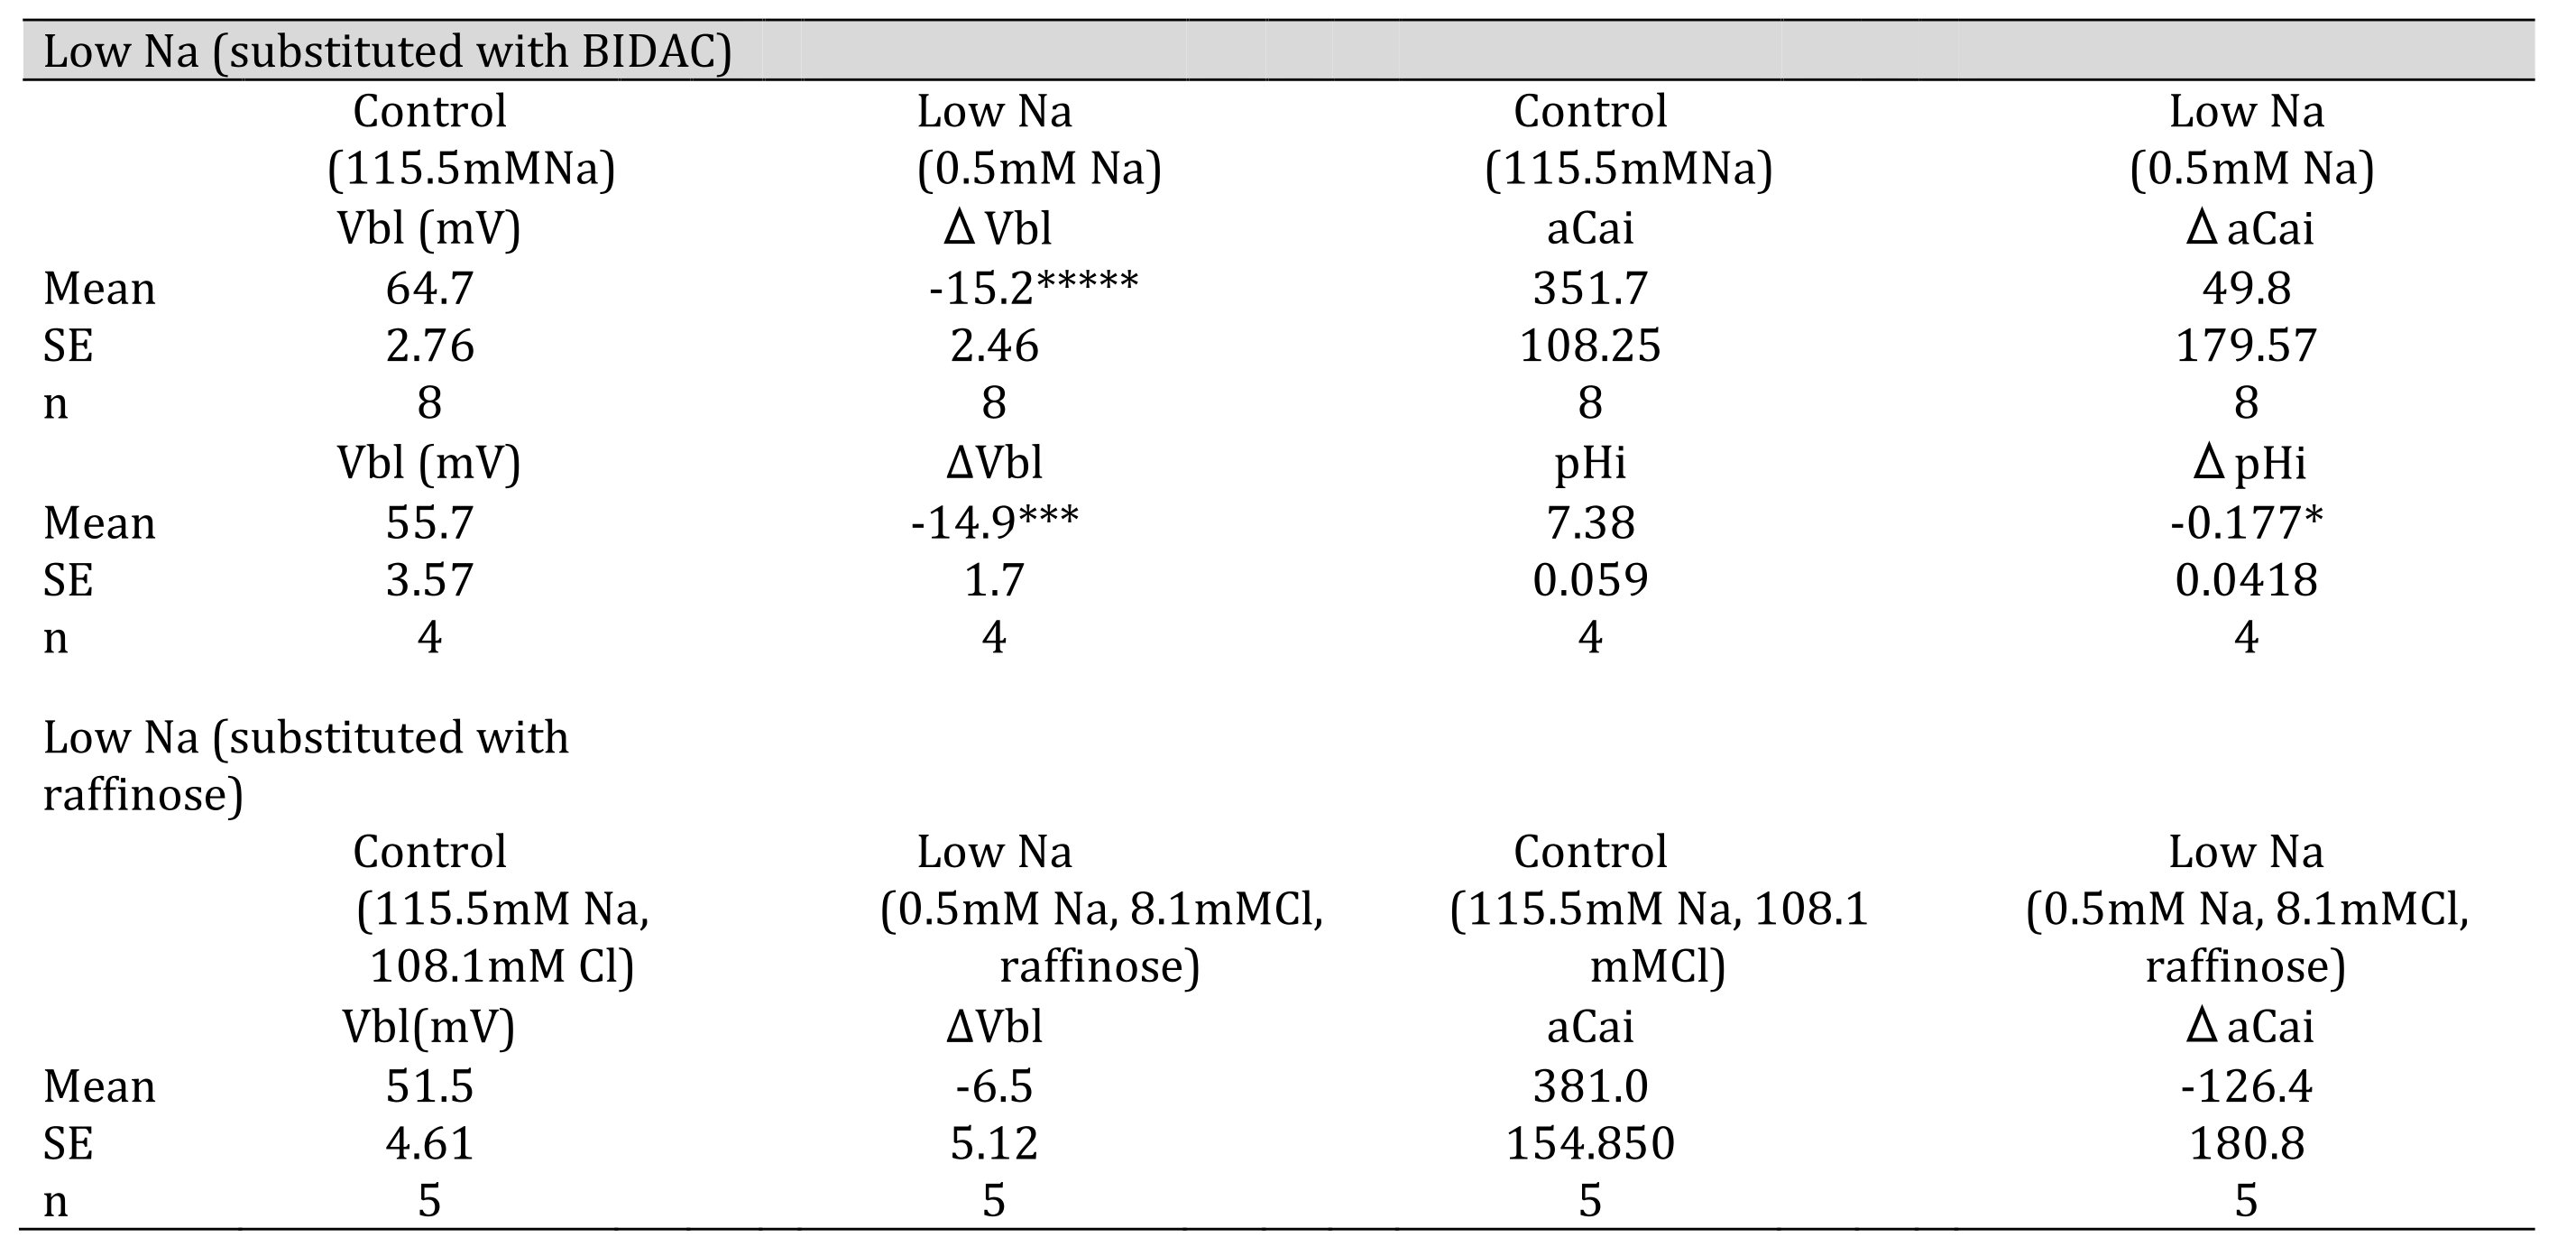
Table 5: 0.5 mM Na (replaced with BIDAC). Vbl was depolarized significantly; aCai was not changed; and cellular pH was significantly decreased( *p < 0.05, ***p < 0.01, *****p < 0.001. 0.5 mM Na (replaced with raffinose). Vbl and aCai were unchanged (ns).
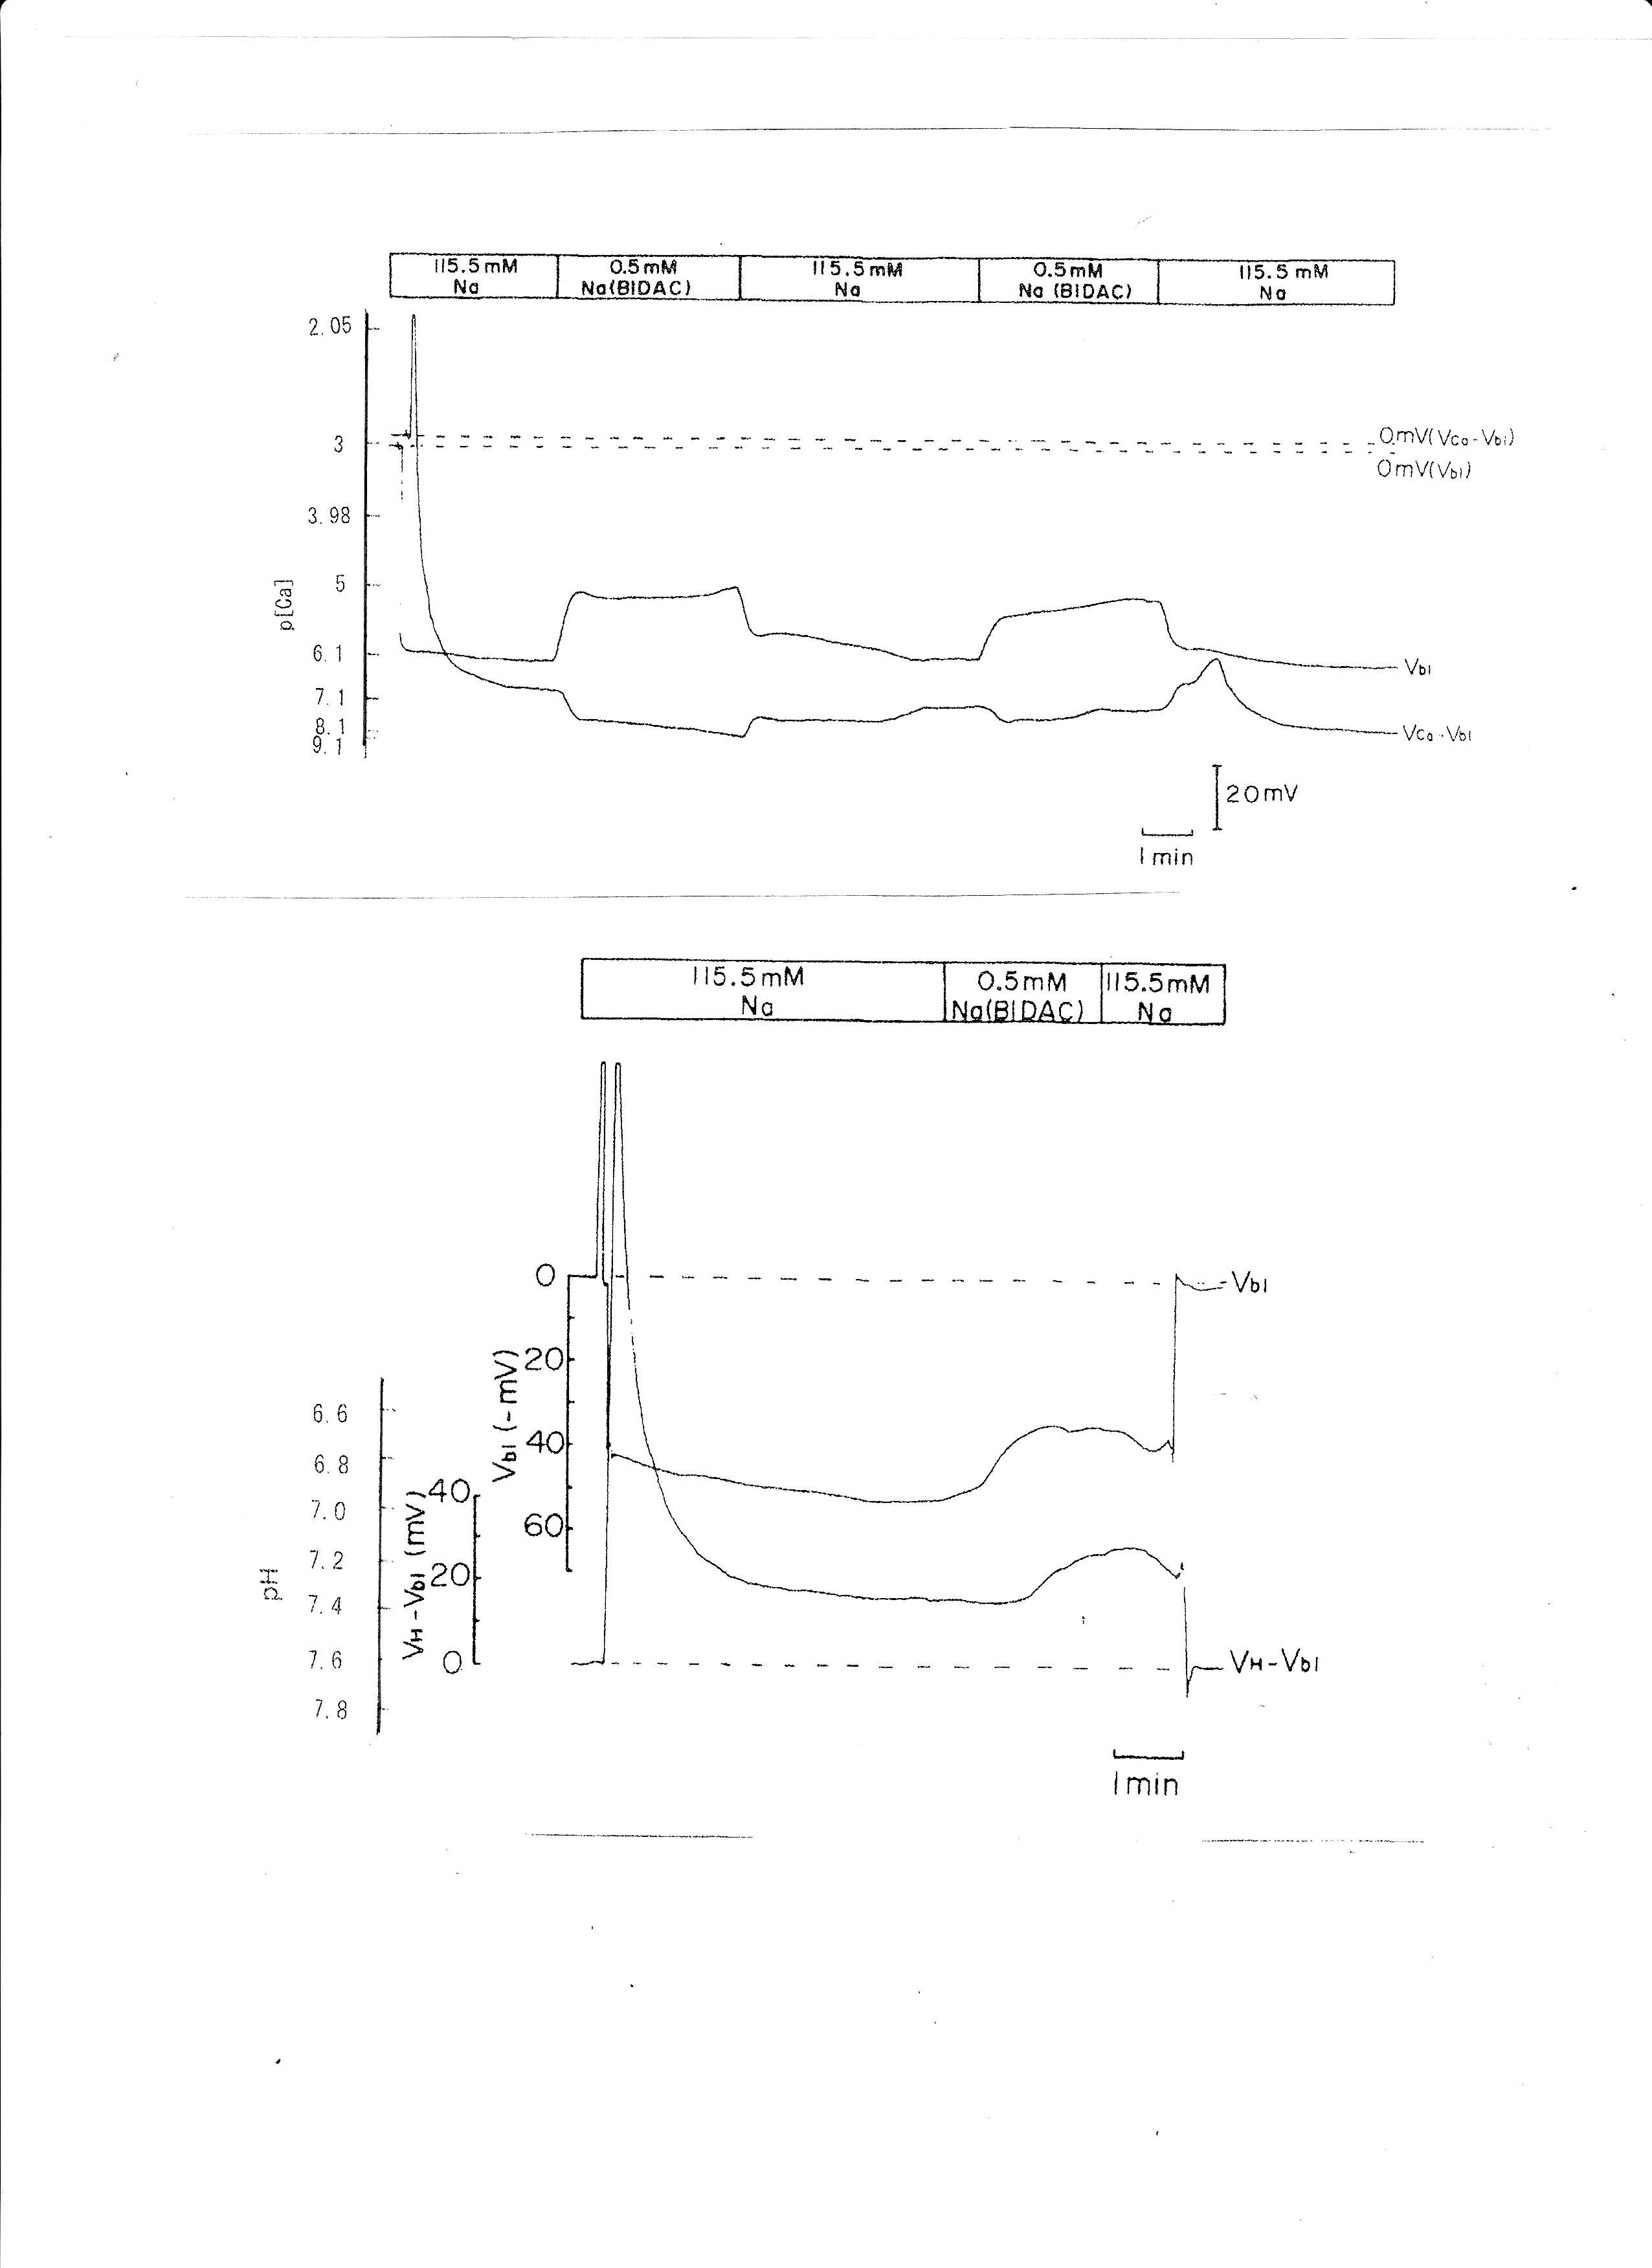
Fig. 9: 0.5 mM Na (replaced with BIDAC). Actual trace of Vbl and VCa-Vbl from Ca2+-selective double-barreled microelectrode. 0.5 mM Na+ (replaced with BIDAC). Actual trace of Vbl and VH-Vbl from H+-selective double-barreled microelectrode.
8. Low Na (substituted with raffinose)
Raffinose has been used as a substitute for Na+ in studies of cell volume regulation (Gyoery et al., 1981; Lopes & Guggino, 1987; Haeussinger et al., 1990; Welling & O'Neil, 1990; Beck et al., 1992). Na+ replaced raffinose from 115.5 to 0.5 mM. The results are shown in Table 5. aCai decreased from 381 to 255.5 nM with 6.5 mV depolarization of the basolateral membrane PD. An actual trace was shown in Fig. 10.
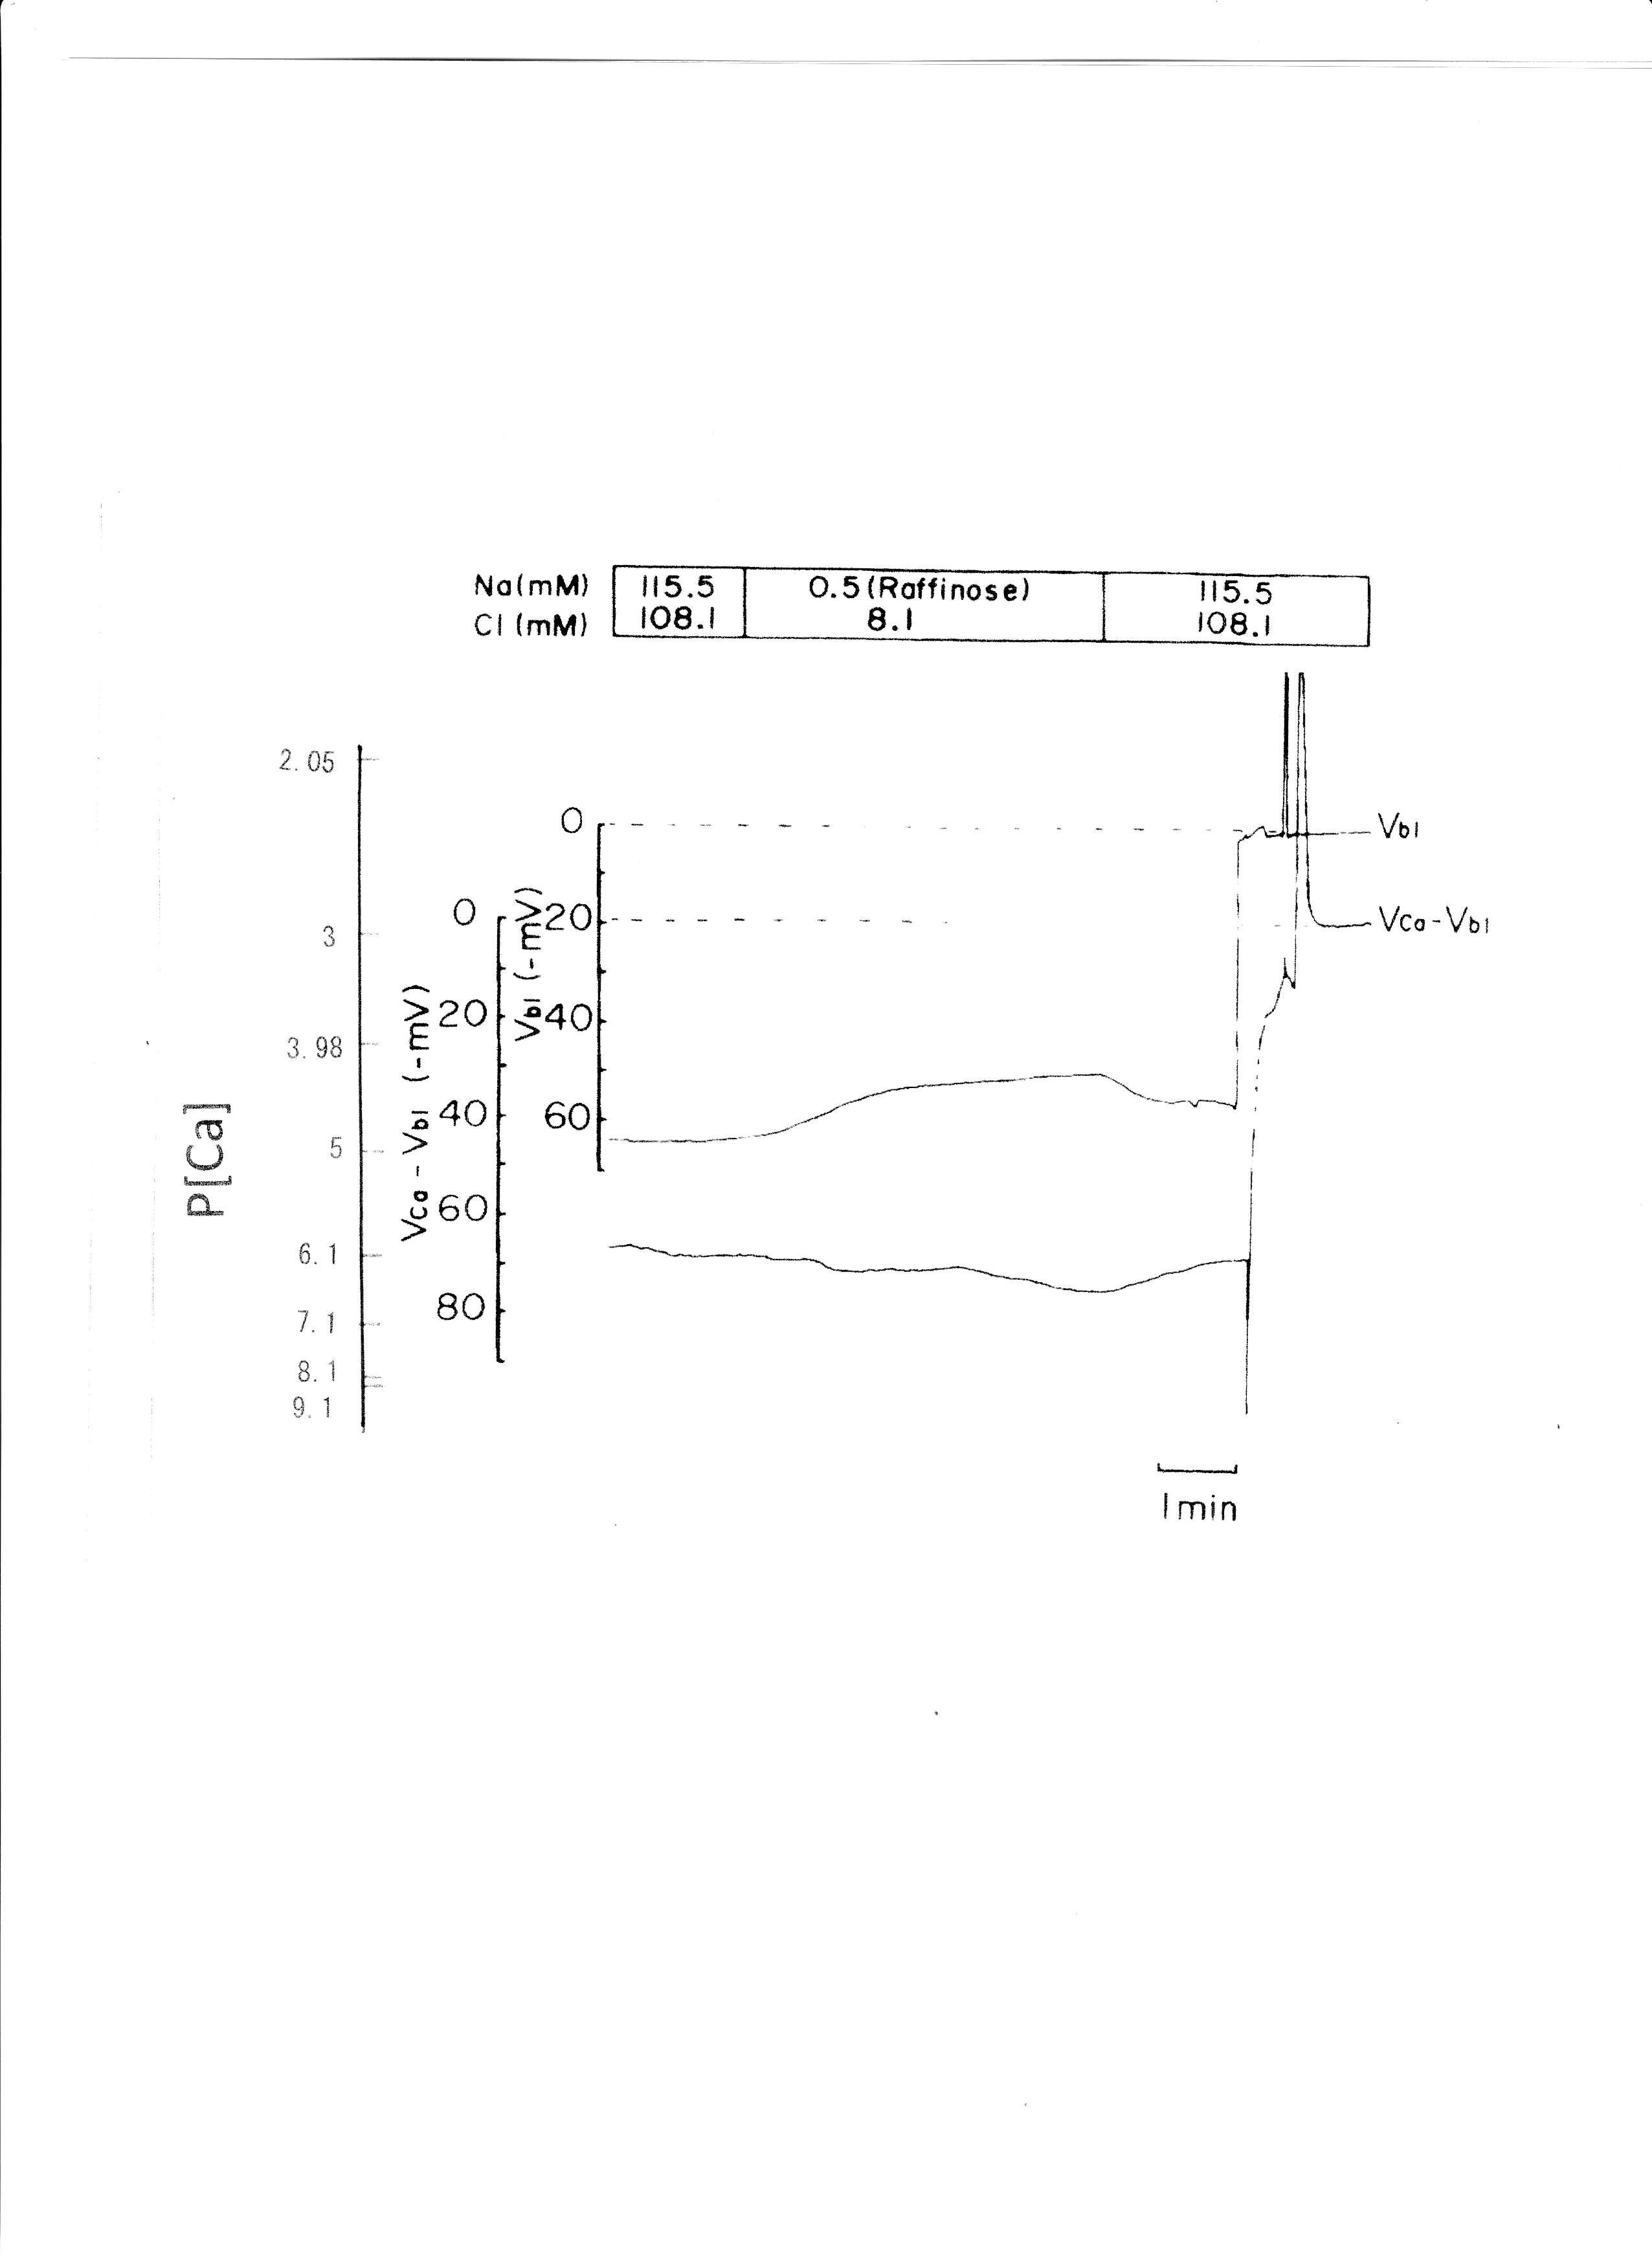
Fig. 10:0.5 mM Na+ (replaced with raffinose). Actual trace of Vbl and VCa-Vbl from the Ca2+-selective double-barreled microelectrode.
9. Luminal low Cl−
Low Cl−, replaced with glucuronate, caused Vte (transepithelial voltage i.e., the potential difference across the epithelium) to hyperpolarize (Fig. 11). Low Cl− solution was applied from a micropipette inserted into one glomerulus.
Cable analysis results were as follows:
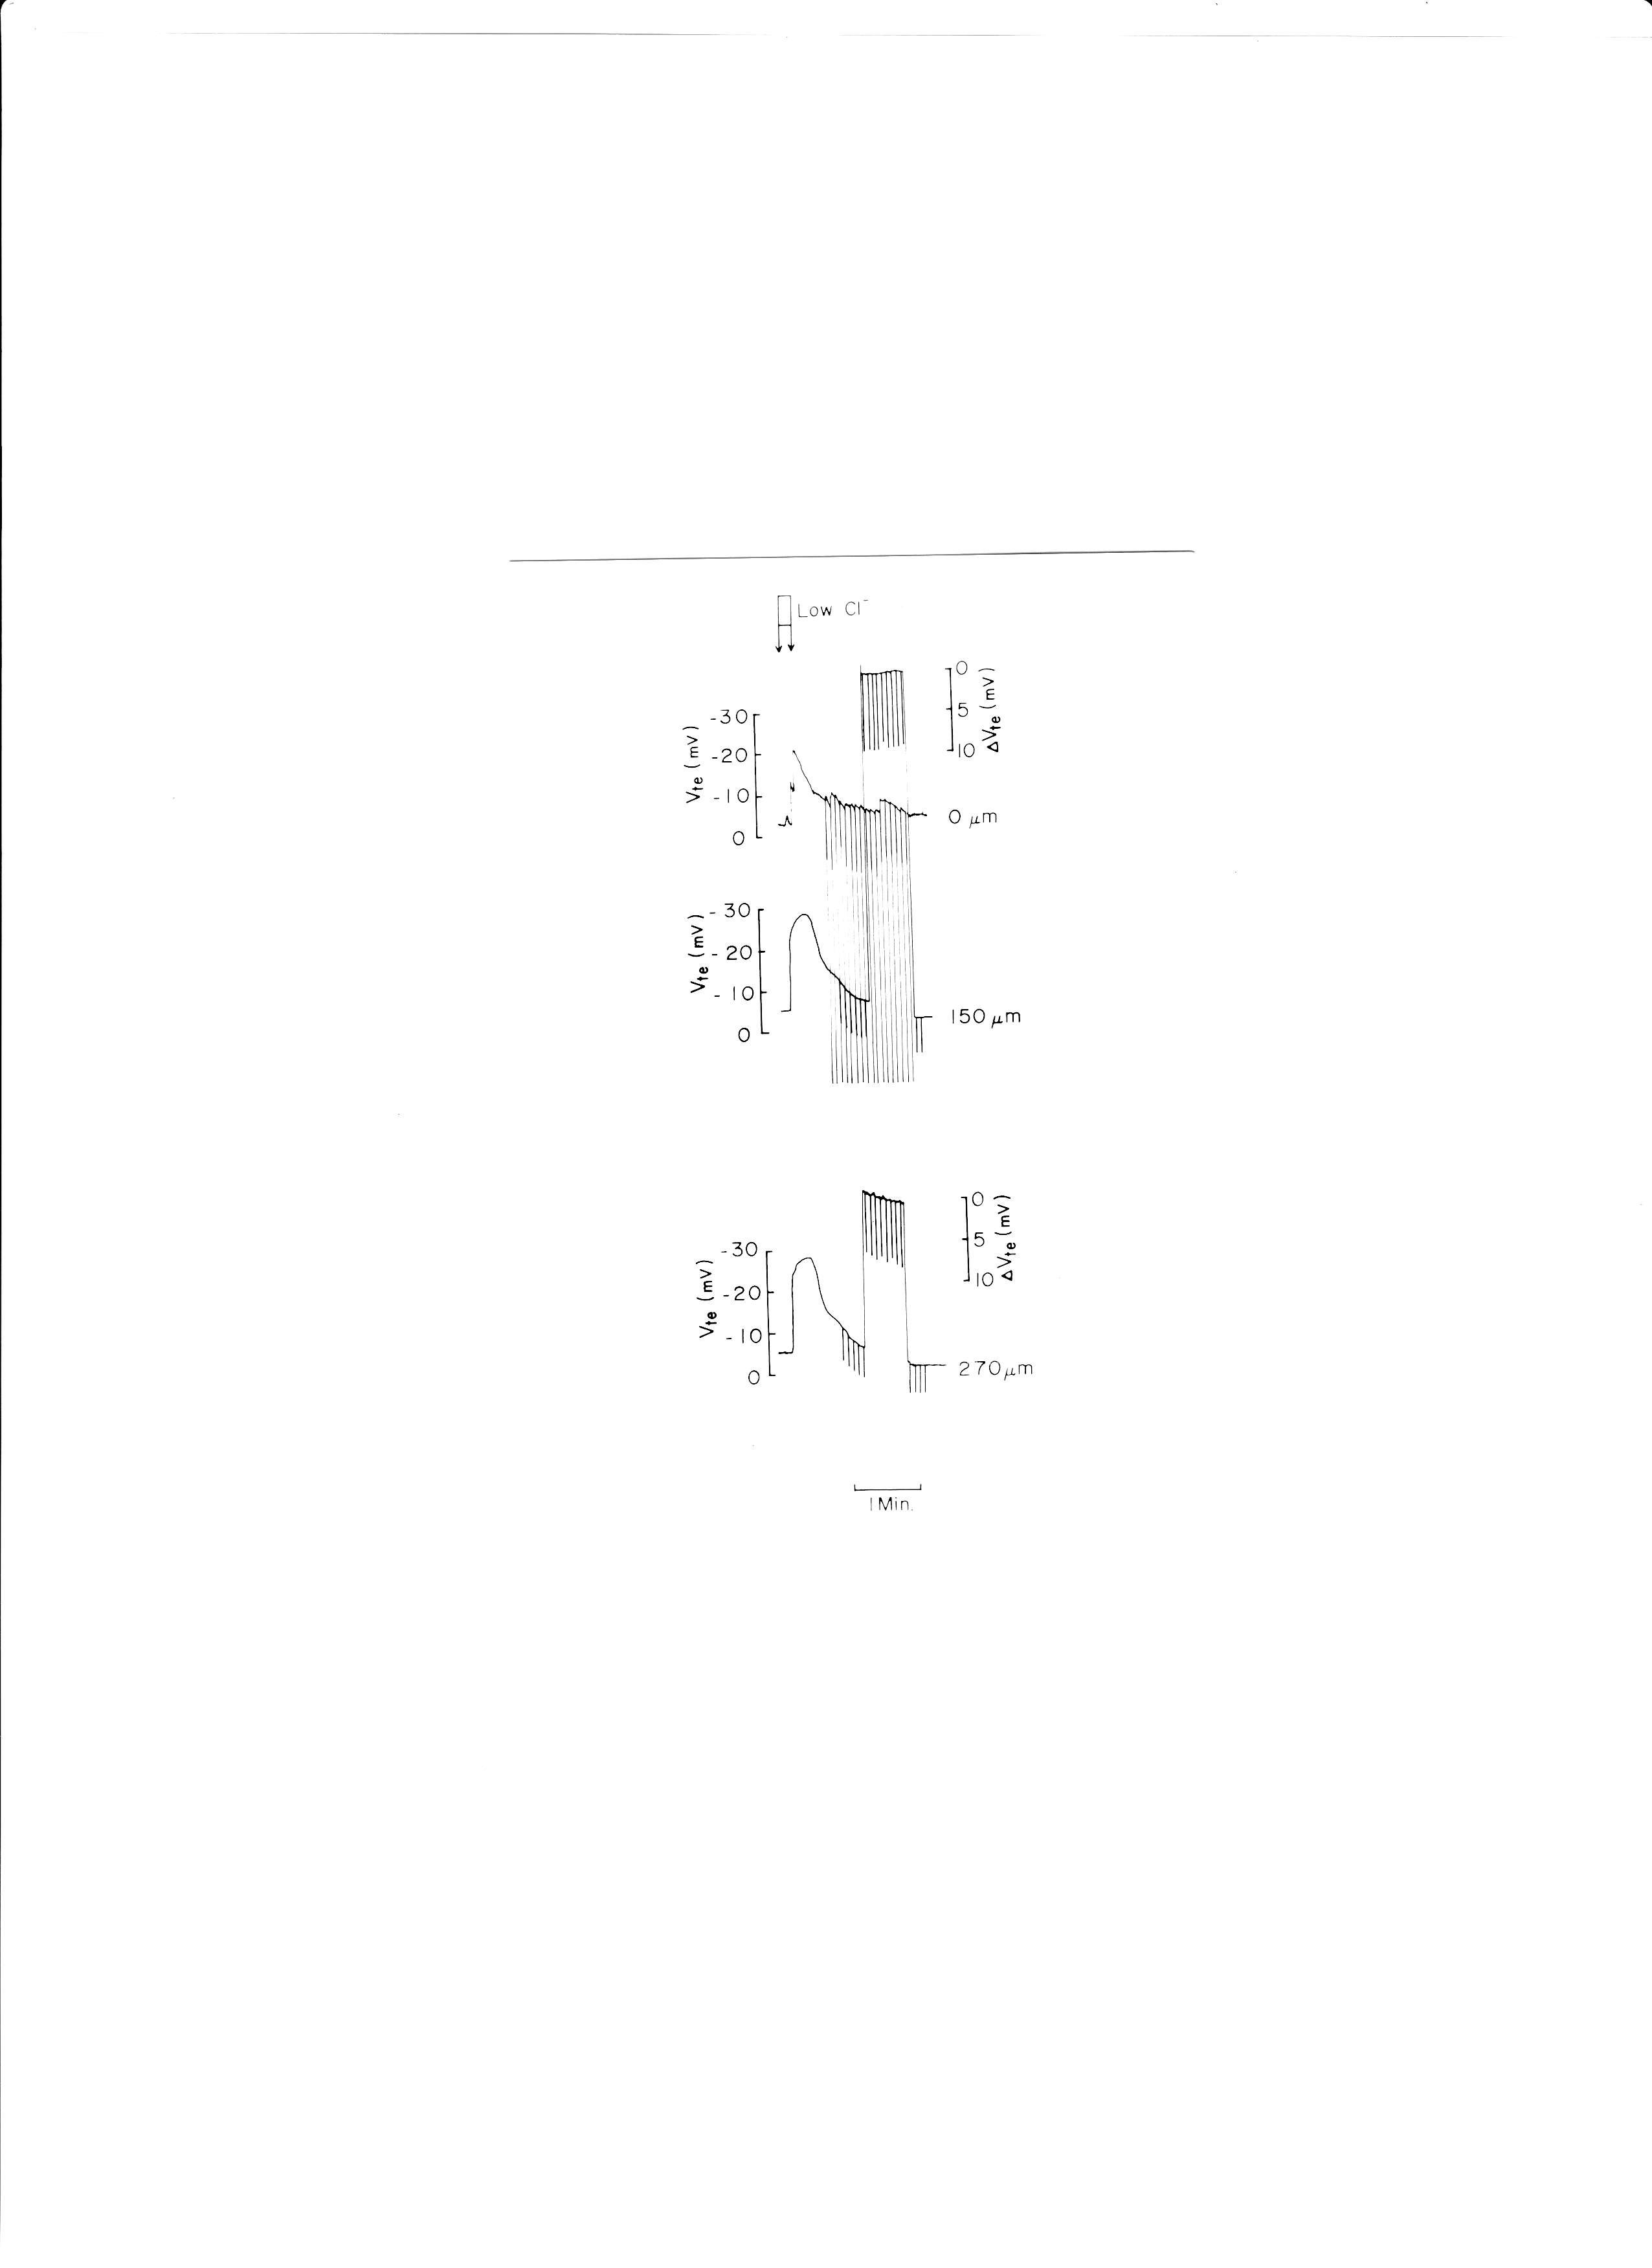
Fig. 11: Actual trace of luminal cable experiments. Low Cl− solution (replaced with glucuronate) was applied to the proximal tubular lumen from a micropipette inserted into the glomerulus. ΔVte was monitored at distances of 150 and 270 μm from the microelectrode which was used to apply electrical currents.
1. cell cable (I0 = 2.5 × 10⁻⁸ A)
a (× 10−4 cm): 21.6 ± 1.6 SE (n = 11)
d: 18.1 ± 0.6
V0 : 17.2 ± 1.6
λc : 172.3 ± 23.2
ρc : 2, 178.7 ± 337.5
Rz : 321.9 ± 63.2
2. luminal cables (I0 = 2.00 × 10⁻⁷ A)
a: 20.9 ± 2.0 SE (n = 8)
d: 14.8 ± 1.2
V0 : 10.7 ± 2.1
λ1 : 648.1 ± 79.5
Vte : −3.4 ± 0.9 (n = 5)
Rte : 459.7 ± 143.0
3. voltage divider ratio (= Ra/Rbl)
Ra/Rbl : 2.22 ± 0.24 (n = 6)
From cell cables, luminal cables, and voltage divider ratio, we determined the following resistances:ρc = 2, 179 ± 338 Ωcm (n = 11), Rs = 662 Ωcm2, Ra = 1, 037 Ωcm2, and Rbl = 467 Ωcm2. These findings suggest that the bullfrog proximal tubule is a leaky epithelium and that there is high Cl− conductance in the paracellular shunt, in agreement with Guggino et al. (1982).
Discussion
The purpose of this study
The goal of this study was to determine (i) whether NCX and NBC can coexist in basolateral membranes of proximal tubules; (ii) the relationship between pHi and aCai; and (iii) the relationship between Na+ transport and pHi or aCai. Our results indicate that (i) NCX and NBC cannot coexist based on thermodynamics; (ii) the relationship between the change of pHi and that of aCai are not always reciprocal; and (iii) cellular H+ ions both influence Na+ transport and are involved in Na+/H+ exchange across the apical membrane.
Non-mammalian vertebrates like bullfrogs have renal systems identical to those of mammalian vertebrates. For example, ADH stimulates adenylate cyclase in frogs, just as in mammals (Dousa, TP, 1974). Yoshimura H et al. (1961) reported that renal regulation of acid-base balance in bullfrogs is identical to that in mammals. Wilkinson et al. (1979) observed the effect of ouabain on K+ transport in perfused bullfrog kidneys. Lang et al. (1984) found that intracellular sodium activity influences glucose transport in bullfrog kidney proximal tubules.
Comparison with previously published work
Yang et al. (1988) and Lorenzen et al. (1984) reported averaged values of aCai, namely 82 ± 7 (SE) nM (n = 54) and 71 ± 7 (n = 21) and pHi, 7.33 ± 0.03 (n = 27) under control conditions in isolated perfused proximal tubules of Necturus maculosus kidney. Fujimoto et al. (1989) reported aCai of 17.2 ± 1.0 (SE) (n = 25) and pHi of 7.39 ± 0.01 (n = 25) in doubly perfused bullfrog kidney proximal tubules under control conditions in vivo. In contrast, under control conditions in vivo, we measured aCai as being 249.6 ± 35.54 (SE) (n = 28) and pHi as 7.33 ± 0.032 (n = 27) in doubly perfused bullfrog proximal tubules using double-barreled ion-selective microelectrodes.
Our results may differ from those of other studies because 1. the use of double-barreled ion-selective microelectrodes instead of single ion selective microelectrodes; 2. the use of 0.38 as the ionic activity coefficient (γCa) instead of 0.35; and 3. in vivo preparation versus isolated perfused preparation.
Klepouris et al. (1985) reported aCai of 215 ± 39 nM (SE) (n = 15) in split frog skin using single-barreled Ca2+-selective microelectrodes.
In a previous study using single-barreled microelectrodes (Fujimoto et al., 1989), the following conditions were tested: 1) 1.5 mM HCO3 at a constant pCO2 of 1.5%; 2) 30 mM HCO3 at a constant pCO2 of 1.5%; 3) 35 mM K solution; 4) 15.5 mM Na substituted with choline Cl; and 5) low-Ca perfusate (~1 × 10⁻⁷ M) at both the luminal and peritubular sides; Experiments 1) and 3) were performed under nearly identical conditions as our other experiments, except that we used 2 mM HCO3− (experiment 1) and 30 mM K+ (3), instead of 1.5mM HCO3− and 35mM K+. In 4), low NaCl was 0.5 mM NaCl substituted with BIDAC instead of 15.5 mM NaCl substituted with choline chloride.
We confirmed the results of prior studies (Lorenzen et al., 1984, Yang et al., 1988, and Fujimoto et al., 1989). The differences are (1) aCai decreased (p < 0.01) instead of increased at high [K+] (Fujimoto et al., 1989). Yang et al., (1988) reported a decrease in aCai at high [K+], in accordance with our results. (2) Different groups have reported that aCai either decreases (Fujimoto et al., 1989) or increases (Lorenzen et al., 1984) under low [Na+]; however, we measured insignificant changes in aCai in both experiments where NaCl was replaced with either BIDAC or raffinose.
Relationship between pHi and aCai
First, we conducted a respiratory acidosis experiment. The applied procedure caused the cells to become acidified. In fact, cellular acidosis occurred at 0.12 pH units (Table 3). Conversely, the level of Ca ions was not significantly altered. The membrane potential difference (PD) (Vbl) was slightly depolarized by 4–5 mV on average. This is discordant with the presence of some types of Ca buffering substances, such as EGTA, which we assumed to be present within the cell. In this state of respiratory acidosis, cell–cell coupling is also closed ((Matsumura, Fujimoto, and Giebisch, 1986). In respiratory acidosis, blood pH was buffered by an increase in HCO3 (renal compensation). Consequently, H transport or HCO3 reabsorption must be enhanced. HCO3 (or CO2) exit may not have any electrostatic charge, in accordance with the slight depolarization. Sensors for basolateral HCO3− and CO2, but not for pH, have been observed in acutely regulated HCO3− transport (Zou, Zaho, and Boron, 2005).
Next, we conducted metabolic acidosis experiments (Table 3). The abrupt decrease in HCO3 from 15 to 2 mM caused a large depolarization (−23 to −17 mV on average). HCO3 exit may have electrostatic charges, i.e., a large depolarization of Vbl. Cell acidosis occurred at 0.15 pH units, and the decrease of cell Ca was −143 nM on average. The cell behaved like Ca-buffering substances such as EGTA. Chloride was kept constant in these experiments. However, Na was increased by 13 mM, and pH was changed by 0.7 pH units (acidosis) in the peritubular perfusate. Fujimoto et al. (1989) obtained similar results.
We also conducted experiments with an abrupt increase of K from 2.5 to 30 mM. Here, the Vbl was depolarized by −21.8 to −33.4 mV on average. Cell pH was increased by 0.233 pH units (alkalosis), and cell Ca was decreased by −203.9 nM on average. K exit may have electrostatic charges, i.e., a large depolarization of Vbl. Here, the cell did not behave as though it contained Ca/H buffering substances such as EGTA. Na was replaced by K in these experiments. The decrease in Ca was in discordance with the increase in Ca reported by Fujimoto et al. (1989). However, Yang et al. (1988) did observe a decrease in cell Ca in 42.5 mM K solution, in accordance with our findings. The discrepancy would be due to the degree of Vbl depolarization among the tubular cells, which affects the Ca reading.
We applied a Ca2+ ionophore to the peritubular perfusate. Cellular Ca2+ increased 225.9 nM on average, whereas cellular pH increased 0.21 pH units on average (cellular alkalosis). Vbl was unchanged at 4.7–2.5 mV. Here, the cell behaved as though it was treated with EGTA, which resulted in alkalosis leading to Ca2+ release, and vice versa. Yang et al. (1988) also reported an increase in cellular Ca2+ with cell alkalosis.
Na+/K+ ATPase is the main Na transport and H extrusion pump via the NHE in the proximal tubule. Ouabain inhibits the release of Na+/K+ ATPase. We applied 10−4 M ouabain from the peritubular side results are shown in Table 4. Ca2+ ion activity was reduced after 2 min and increased subsequently after 5 min. Cellular acidification was observed (Matsumura et al., 1985; Fujimoto and Morimoto, 1986). Ouabain’s effects include cellular acidification and an initial decrease in aCai, followed by an increase. Cell swelling is also associated with these changes. Lang et al. (1983) and Wang et al. (1984) also found that cellular Ca2+ increased and cellular alkalization occurred 31 min after frog kidney proximal tubules were treated with 10−4 M ouabain, regardless of experimental design i.e., short vs. long application. We think that the increase in aCai may be due to cellular Ca2+ pools such as the mitochondria.
Four experiments with low Na+, i.e., Na+ was replaced with either BIDAC or raffinose. The results are shown in Table 5 (replaced with BIDAC and replaced with raffinose). Vbl was depolarized by either −14.9 or −15.2 mV on average. Cellular pH was decreased by 0.177 pH units (p < 0.05). Cellular Ca increased by 49.8 nM (ns) on average. Moreover, we examined cellular Ca2+ upon substitution with raffinose (Table 5). Vbl was depolarized by −6.5 mV (ns) upon raffinose substitution. Cellular Ca2+ decreased 126.4 nM (ns) on average. This decrease in cellular Ca2+ contrasts with the increase upon BIDAC substitution and may involve cell volume regulation. However, we did not collect data on cell volume in this study. Guggino et al. (1985) replaced 1 mM NaCl with 2 mM raffinose to maintain the perfusate’s iso-osmolarity.
In the experiment in which low Na+ was replaced with raffinose, an unknown mechanism may be involved because of the lack of change in Vbl following exposure to low-Na+ perfusate. A possible explanation for the small change in Vbl is the removal of both Na+ and Cl− from the perfusate. The circulating current (Sackin and Palmer, 2013) would be increased in the substitution experiments (e.g., low Na+ and 30 mM K+), and the apparent ΔVbl caused by the substitution was higher than the real ΔVbl under low Na+ substitution and decreased under 30 mM K+ substitution. Because Na+ ions flowed from the lumen to the basolateral space via the paracellular pathway, K+ ions flowed from the basolateral space into the lumen. The circulating current did not change following raffinose substitution. Because NaCl was replaced in the raffinose experiment, Na+ ions moved from the lumen into the basolateral space along with Cl− ions i.e., in neutral form.
Experiments in which low Na+ was replaced with choline chloride were conducted (Fujimoto et al., 1989; Lorenzen et al., 1984). The results differed between studies: a decrease in cellular Ca2+ was observed by Fujimoto et al. (1989) whereas Lorenzen et al. (1984) observed an increase. We did not observe significant changes in cellular Ca2+ upon substitution with BIDAC or raffinose. Our results are consistent with those of Fujimoto et al., indicating that the presence of an NCX in the basolateral membrane plays a minimal role in cellular Ca2+ homeostasis.
Another possibility is heterogeneity in the proximal tubules (early or late portion). We used only the early portion of the proximal tubules.
Calculating cellular Na+ and electrochemical driving force for Na+ across the basolateral membrane of tubular cells (Thermodynamic consideration)
We calculated cellular Na+ activity (i) from the measured pHi (Tables 6 and 8) and (ii) from the measured aCai (Tables 7 and 9). The results did not agree with previously measured values. The coexistence of an NBC and an NCX were ruled out by thermodynamic considerations. This calculation disagrees with experimental measurements, which suggests that there is no NCX in the basolateral membrane.
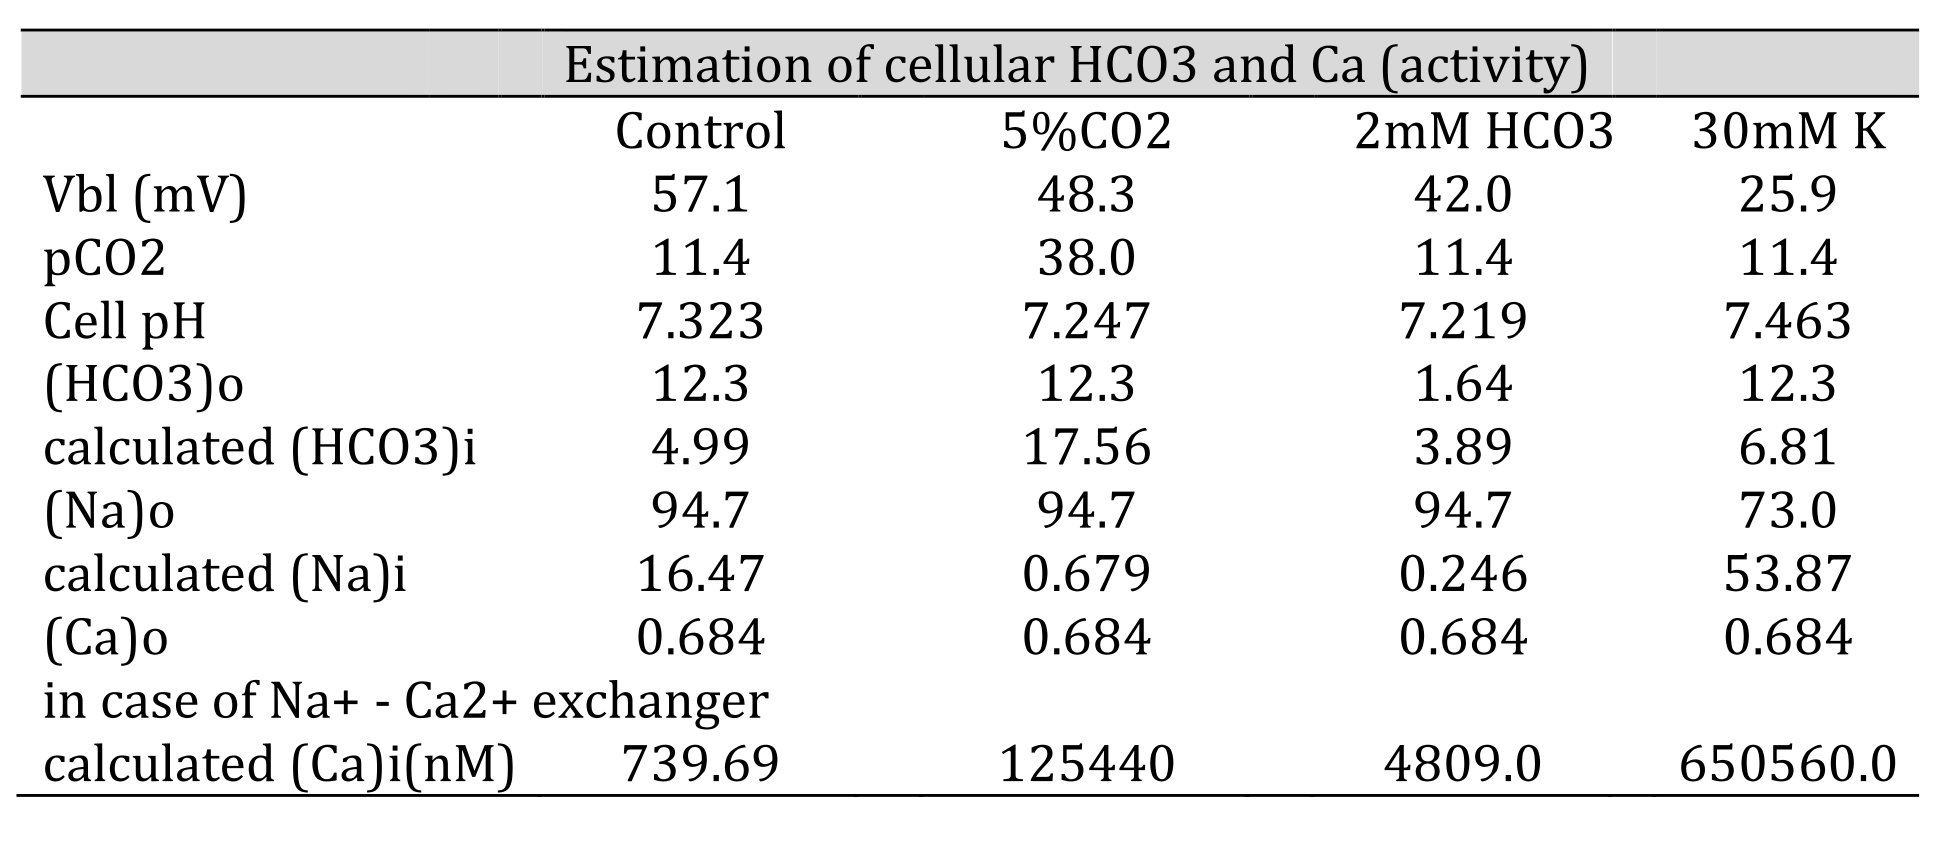
Table 6: Estimation of cellular HCO3, Na, and Ca(activity). The procedures are for calculating HCO3− from pH, Na+ from HCO3−, and Ca2+ from Na+. [HCO3−](mM) = 25.1 × pCO2 (mmHg)/[H+] (nM). Nai=102/2.3x0.04xVbl × (HCO3−o/HCO3−i)3 × Nao. Cai=10−2.174x0.04xVbl × (Nai/Nao)3 × Cao. We adopted γHCO3 = 0.82, γNa = 0.82, and γCa = 0.38, and a Na+–HCO3− stoichiometry of 1:3. Under low Na+, cellular Ca2+ activity is predicted to increase. However, the experiment did not detect an increase in cellular Ca2+ activity, suggesting that there are no Na+/Ca2+ exchangers.
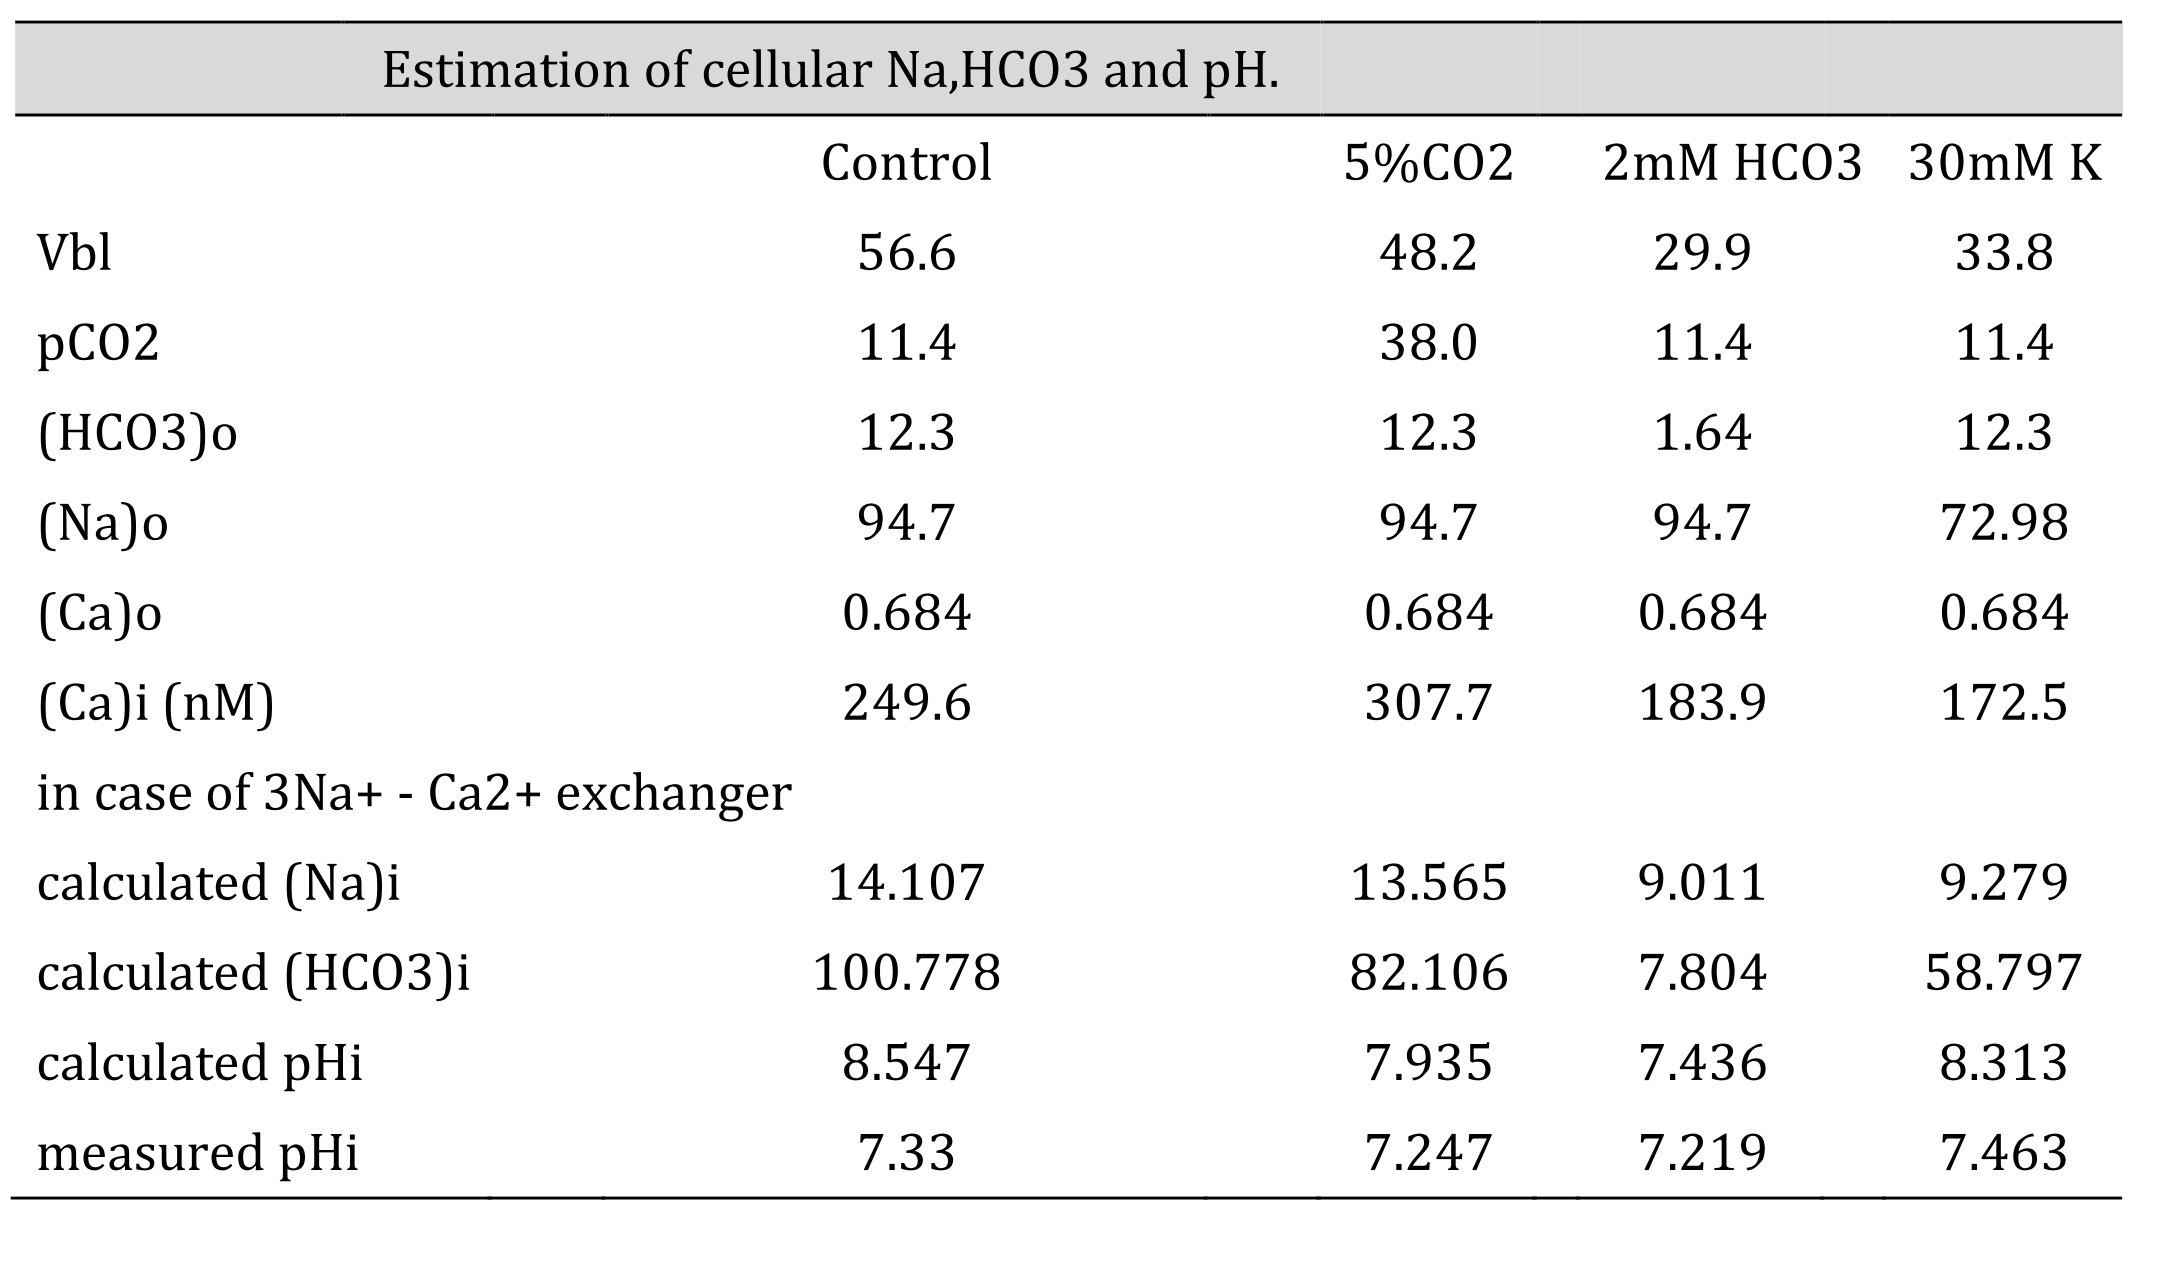
Table 7: Estimation of cellular HCO3, Na and Ca(activity). The procedures are the calculation from Ca to Na , from Na to HCO3 and from HCO3 to pH. Nai=10Vbl/(3 x 59.157) × (Cai/Cao)1/3 × Nao. HCO3i = 10(2/3)x16.9042 x 5 x (Na0/Nai)1/3 x HCO3o. [HCO3−](mM) = 25.1 × pCO2 (mmHg)/[H+] (nM). We adopted γHCO3 = 0.82, γNa = 0.82, and γCa = 0.38, and a Na–HCO3 stoichiometry of 1:3. In low Na, the cell is predicted to be alkalinized. However, the experiment did not show such alkalinization, suggesting that there were no Na+/3HCO3- cotransporters.
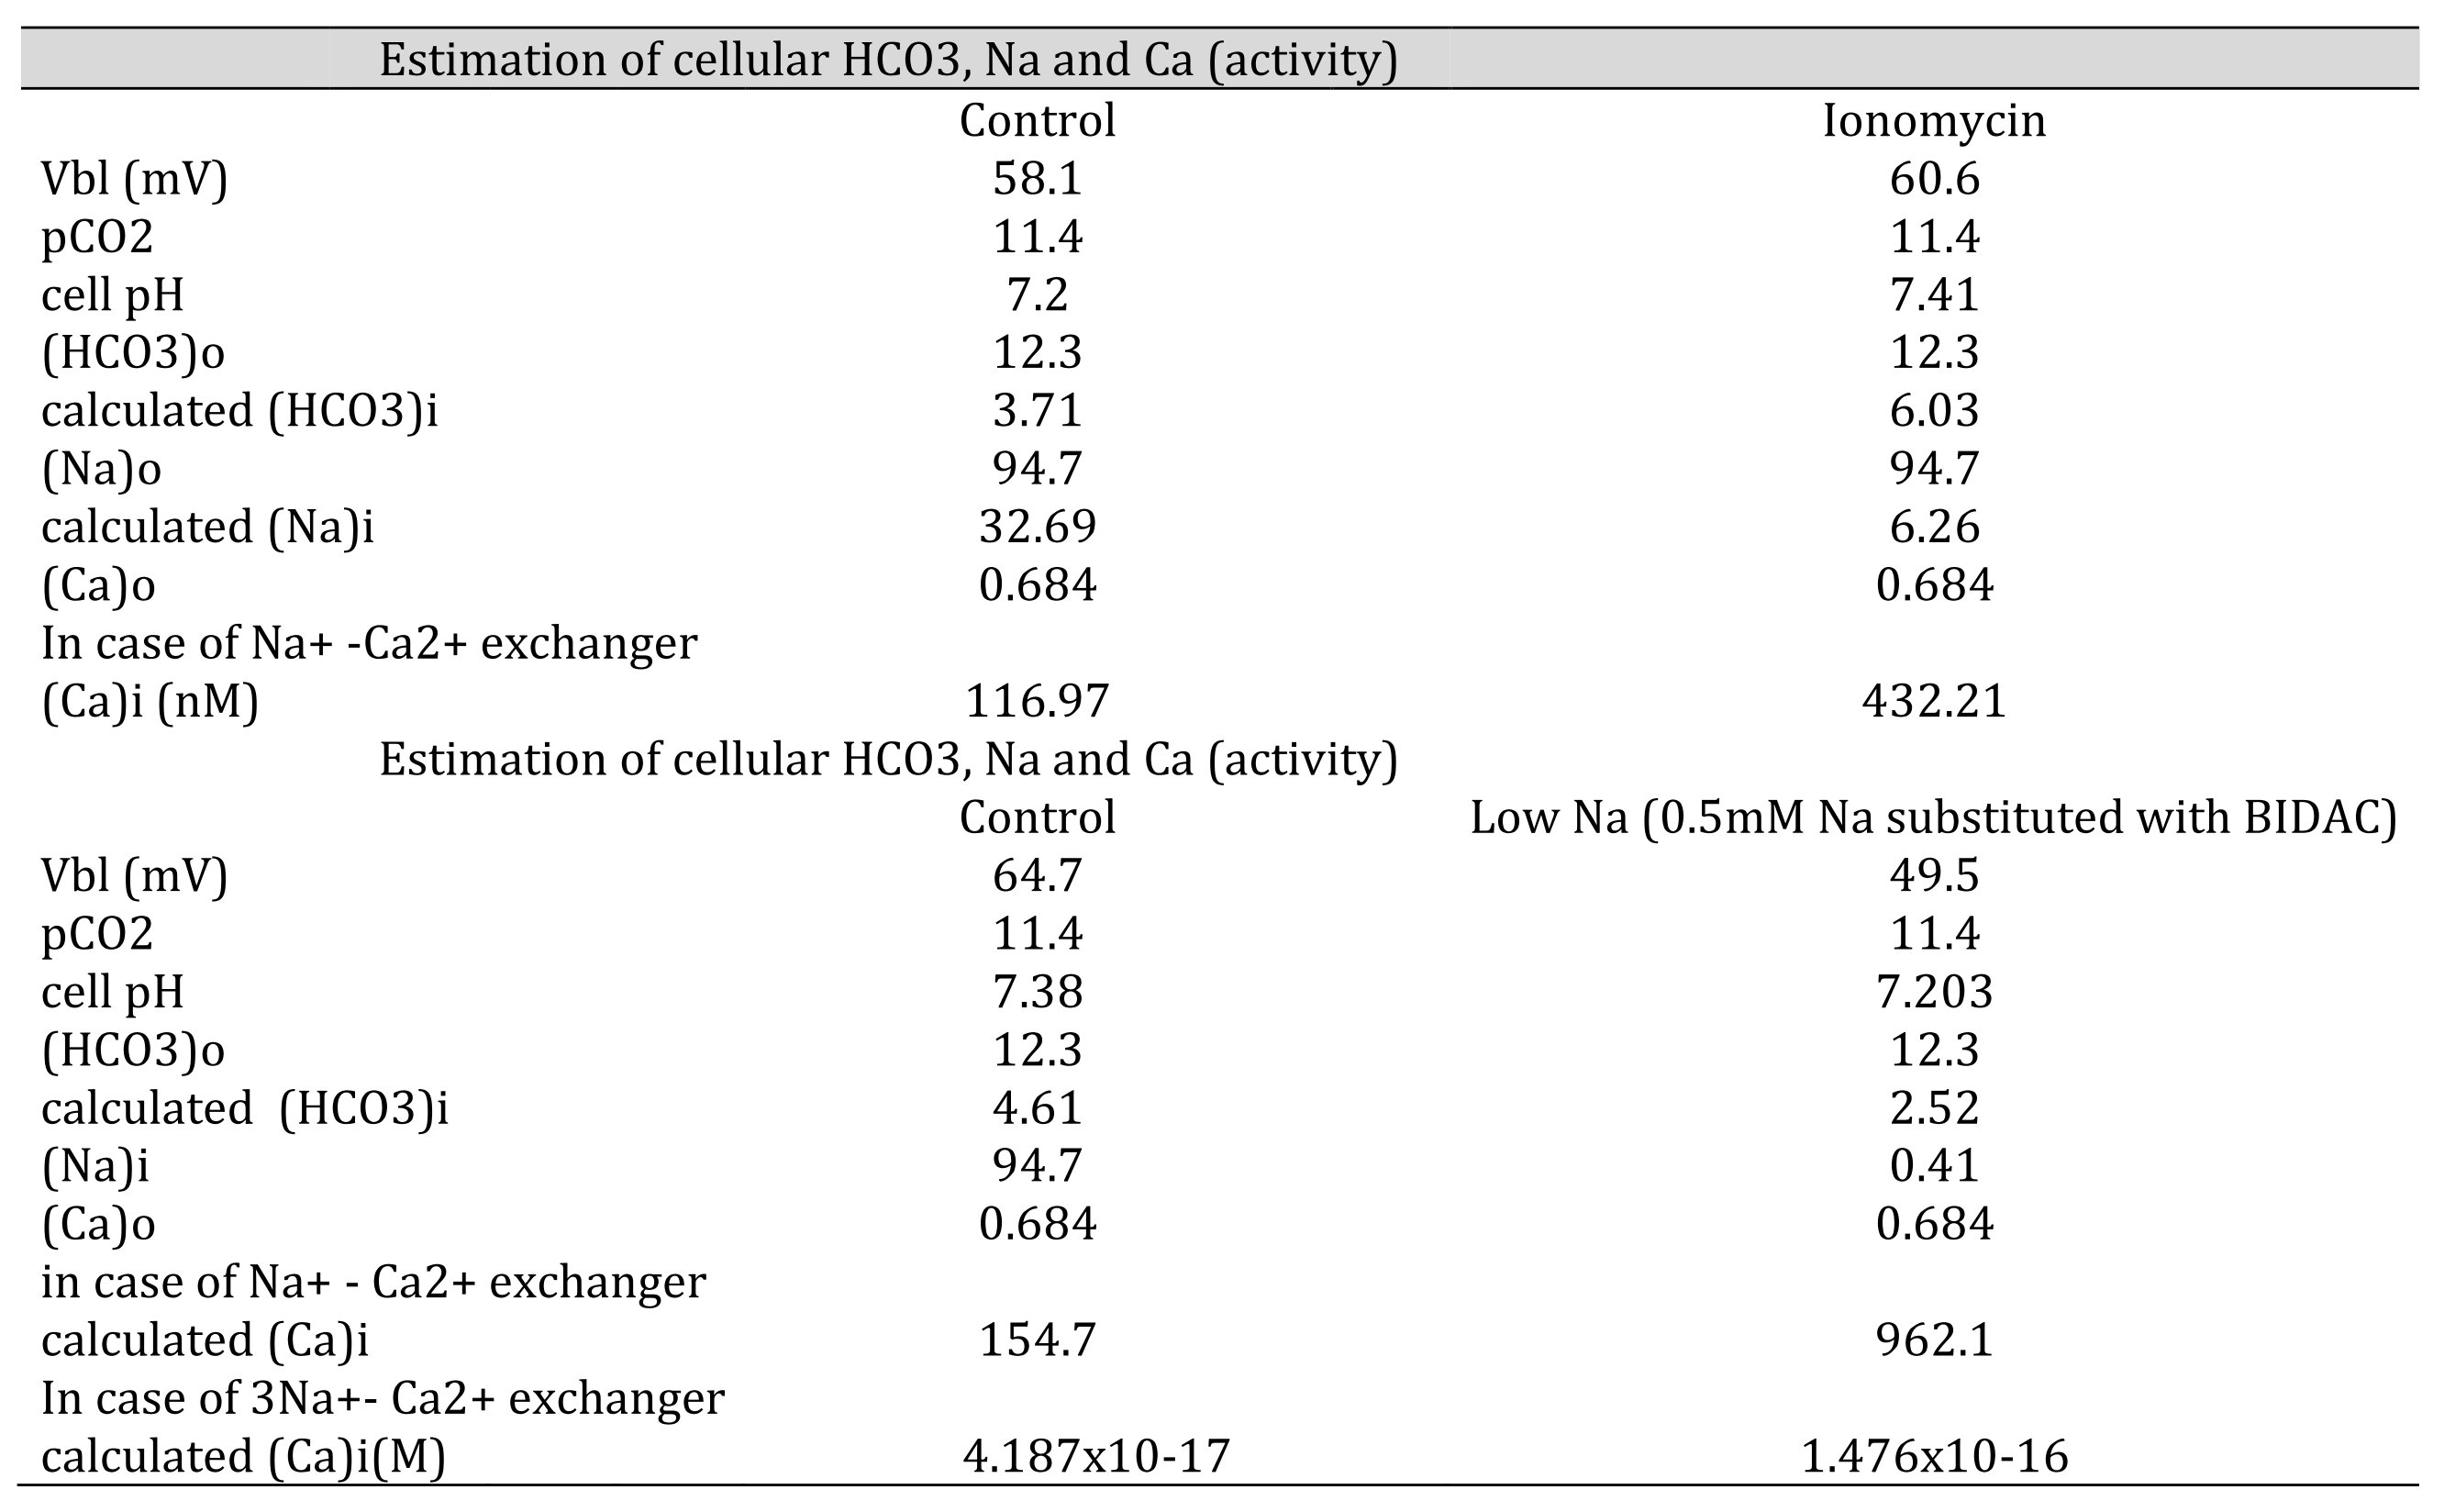
Table 8: Estimation of cellular HCO3, Na, and Ca(activity). The procedures are the calculation from pH to HCO3, from HCO3 to Na and from Na to Ca. [HCO3−](mM) = 25.1 × pCO2 (mmHg)/[H+] (nM). Nai=102/2.3x0.04xVbl × (HCO3−o/HCO3−i)3 × Nao Cai=10−2.174x0.04xVbl × (HCO3−iHCO3−o)3 × Cao We adopted γHCO3 = 0.82, γNa = 0.82, and γCa = 0.38, and a Na-HCO3 stoichiometry of 1:3. In low Na, cellular Ca activity is predicted to be increased. However, the experiment did not show an increase in cellular Ca activity, suggesting that there are no 3Na–Ca2+ exchangers.
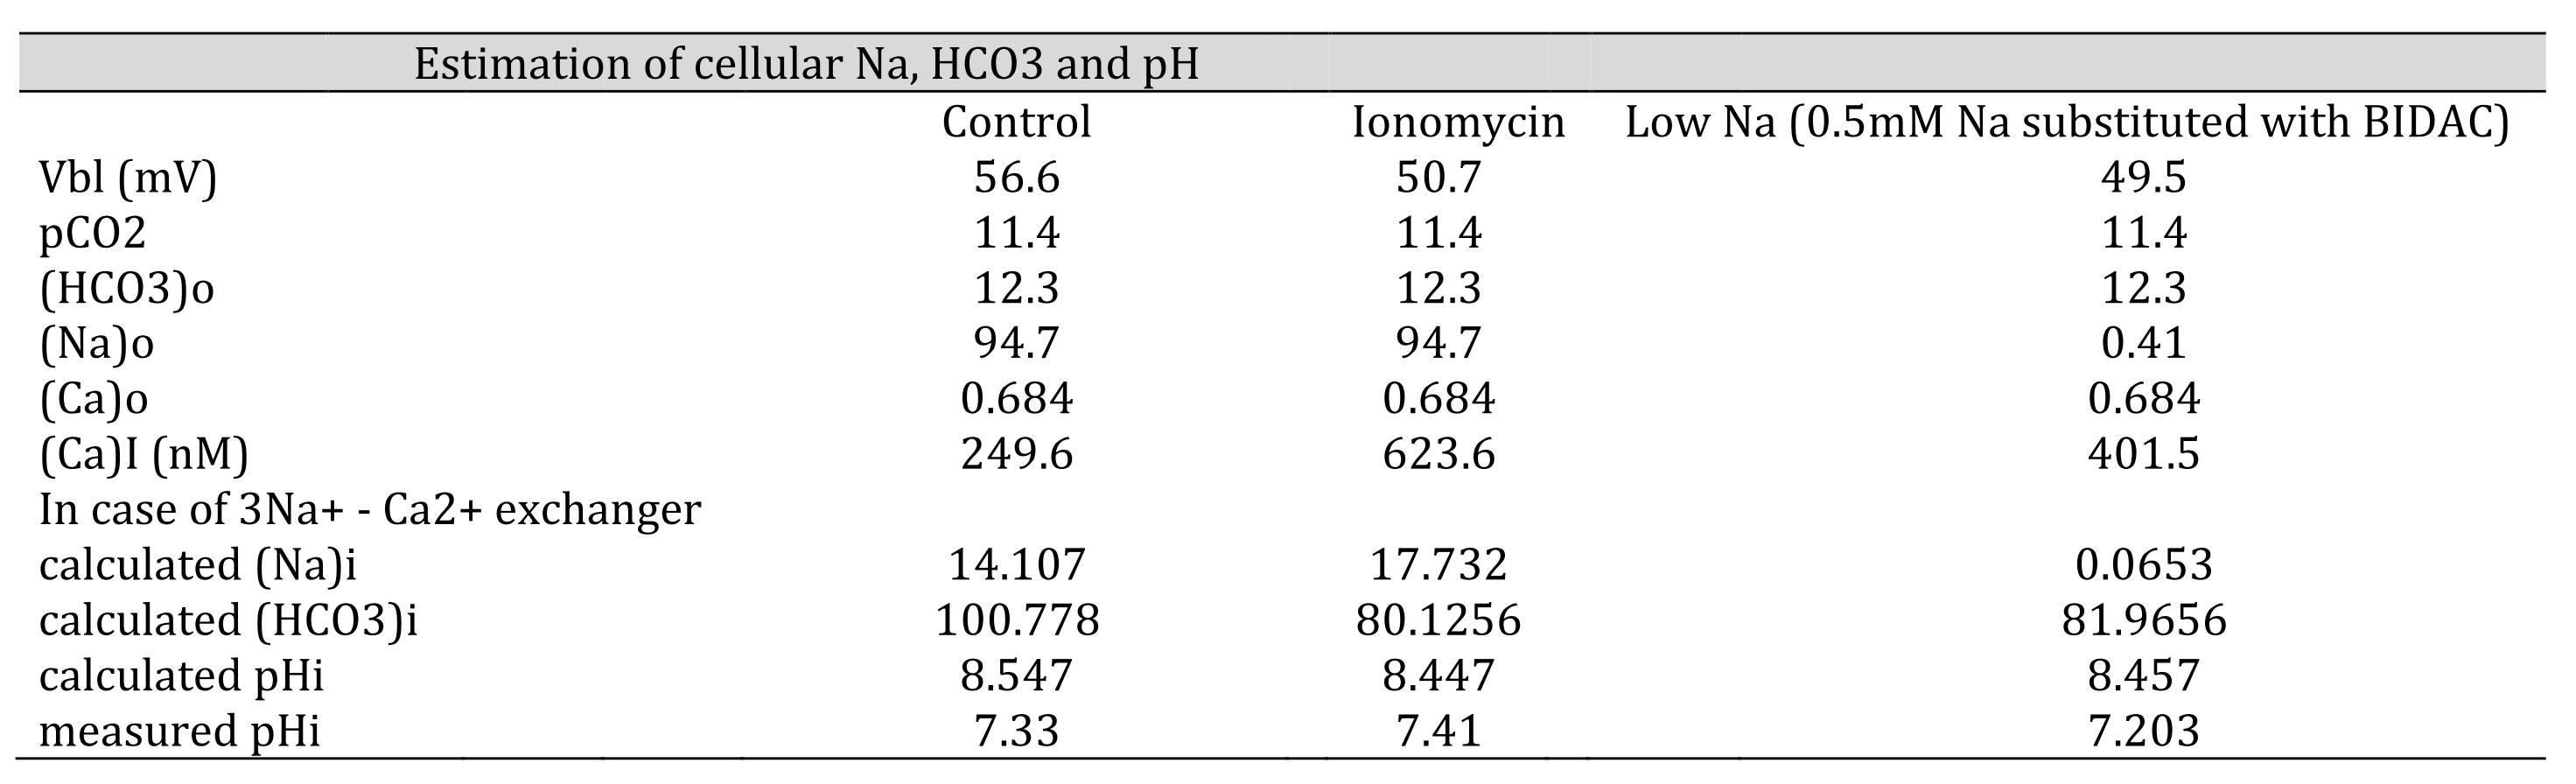
Table 9: Estimation of cellular HCO3, Na and Ca(activity). The procedures are the calculation from Ca to Na , from Na to HCO3 and from HCO3 to pH. Nai=10Vbl/(3 x 59.157) × (Cai/Cao)1/3 × Nao. HCO3i = 10(2/3)x16.9042 x 5 x (Na0/Nai)1/3 x HCO3o. [HCO3−](mM) = 25.1 × pCO2 (mmHg)/[H+] (nM). We adopted γHCO3 = 0.82, γNa = 0.82, and γCa = 0.38, and a Na–HCO3 stoichiometry of 1:3. In low Na, the cell is predicted to be alkalinized. However, the experiment did not show such alkalinization, suggesting that there were no Na–3HCO3 cotransporters.
Neither approach yielded reasonable results. Both the NBC and NCX could not be present in the same cell membrane. We speculated that an NBC might be present based on our low Na+ experiments and low HCO3− experiments (metabolic acidosis).
Our results are consistent with those of a previous study (Fujimoto et al., 1989), indicating that the basolateral membrane lacks an NCX.
Localization of the Na+/Ca2+ exchanger
In rabbit kidney, the NCX is present on the basolateral surface of the majority of cells in the connecting tubule. Meanwhile, in other nephron segments, it has been speculated that there is no expression of the NCX (Ramachandran & Brunette (1989), Reilly et al. (1993)). In rat distal convoluted tubule enriched with cloned NCX, the exchanger plays a major role in active Ca2+ reabsorption. This must be the case in distal tubules, but not in proximal tubules (Yu et al. (1992)). In addition, Na+ replacement in rabbit proximal tubules increases ionized Ca2+ by increasing mitochondrial Ca2+ efflux but not by inhibiting Na+–Ca2+ exchange at the plasma membrane (Mandel and Murphy (1984)).
Histological evidence of NBC (tissue-level analysis)
We could not perform tissue-level analysis. However, Maunsbach et al. (2000) and Schmitt et al. (1999) reported the presence of rkNBC1 (rat kidney NBC1) in convoluted segments of the rat kidney proximal tubules using immunohistochemistry; they found that distinct immunogold labeling was associated with the basolateral plasma membrane but not the apical plasma membrane of the S1 and S2 segments of the proximal tubule, whereas no labeling was observed in S3. Moreover, they observed stronger labeling in the late distal segment of the Ambystoma maculatum kidney and weak labeling in the basolateral membrane of the proximal tubule.
By contrast, Abuladze et al. (1998) investigated axial heterogeneity of NBC expression in the rabbit proximal tubule by in situ hybridization. They found that NBC mRNA is localized predominantly to the cortex; lower levels of NBC were detected in the outer medulla and none was detected in the inner medulla. They concluded that NBC mRNA is most abundant in the S1 segment of the proximal tubule, least abundant in the S3 segment, and expressed at intermediate levels in the S2 segment. Giebisch et al. (2017) described the cellular mode of H+ secretion and concluded that the NBC is located in both the basolateral membrane of the early proximal tubule (S1) and the late proximal straight tubule (S3).
Na+ transport association with pHi and aCai
As shown above, cellular acidification causes a decrease in cellular Ca. However, in respiratory acidosis, this relationship is broken, although the meaning of this is unclear. Vbl changed only a little, which means that this process could not involve any charge-carrying system.
Exocytosis, intracellular pH, and intracellular calcium play key roles in mediating CO2-stimulated H+ secretion in the turtle bladder (Arruda et al., (1990)). In addition, it has been hypothesized that Na/K-ATPase endocytosis couples pumping and leaking activities (i.e., Na–H exchanger) in renal epithelial cells (Liu, (2006)). After incubation with a low dose of ouabain (nanometer order) as an intrinsic hormone for 1 h, LLC-PK1 cells showed protein trafficking of the Na/K-ATPase α1 subunit and NHE3 (Na+/H+ exchanger, isoform 3) via ouabain-activated Na/K-ATPase signaling (Yan et al., 2012, Cai et al., 2008, Liu and Xie, 2010). In the case of 30 mM K+ and low Na (BIDAC), the reciprocal relationship between cell pH (or cell H) and aCai is broken.
(I) Whole-body experiments
Assuming that proximal Na+ transport is the main source of electrolyte changes in the kidney, whole-body experiments must be considered.
(a) Respiratory acidosis
Respiratory acidosis stimulates H+ secretion and enhances NaCl transport in proximal tubules. Mild hypernatremia (Δ[Na+],2-4 mEq/L) is typically observed in both acute and chronic hypercapnia (Brackett, Cohen and Schwartz, 1965). Chloruresis appears to transcend acid excretion during the first one or two days of adaptation; the difference is accounted for by an increase in Na+ and K+ excretion (Madias & Adrogue, 2003). Micropuncture observation in the rat proximal tubule indicate that, whereas absolute bicarbonate reabsorption is increased only mildly in acute hypercapnia, a substantial increase is observed during chronic hypercapnia (Cogan, 1984). Parallel increases in the rates of luminal Na+/H+ exchanger (NHE-3) and the basolateral Na+/HCO3− cotransporter in the proximal tubule have been identified reflecting an increase in the Vmax of each transporter but no change in the Km for sodium (Krapf, 1989 and Ruiz, Arruda, and Taylor, 1989). However, others have not confirmed the presence of a stimulated Na+/H+ exchanger during chronic hypercapnia (Northrup et al., 1988). The signal that triggers renal adaptation to hypercapnia remains undefined. Present evidence favors an increase in PaCO2 itself rather than a decrease in systemic pH (Madias, Wolf and Cohen.1985).
(b) Metabolic acidosis
Metabolic acidosis stimulates H+ secretion but inhibits NaCl transport in proximal tubule. Both acute and chronic metabolic acidosis are associated with natriuresis (Haeussinger D and W Grok. 1984). Both proximal and distal tubular sodium reabsorption appear to be inhibited (Cogan and Rector Jr. 1982, De Sousa et al., 1974, Levine DL et al., 1976, Mahnensmith R et al., 1978). The proximal effect is the result of downregulated organic-anion stimulated NaCl reabsorption, while HCO3− reabsorption is enhanced because of increased expression of and activity by NHE-3 (Wang T et al., 1998, Ambuehl PM et al., 1996, Booth, Tsai and Morris Jr. 1977).
Increased insulin secretion in response to acute metabolic acidosis suggests that an insulin response counter-regulates any acidemia-induced cellular potassium efflux, resulting in stable plasma potassium concentrations (Wiederseiner et al., 2004).
(c) High K+ solution
Proximal NaCl transport is inhibited by the peritubular high K solution, although the high K solutions are 5, 7.5, and 10 mEq/l K (Brandis, Keyes, and Windhager, 1972).
(II) Micropuncture study and isolated tubular perfusion study
The experimental condition is that, with the luminal side solution constant, the basolateral side solution is changed. This situation differs from the whole body study with regard to the constant luminal solutions. The micropuncture study and isolated tubular perfusion study are suitable for our consideration of experiments.
(1) Metabolic acidosis
(2) Respiratory acidosis
(3) High K+ in the basolateral solution
(4) Low Na+ in the basolateral solution
Since ionomycine and oubain are the causes, not the effects, in the inhibition of Na+ transport, we omit them from this consideration.
(1) Metabolic acidosis
Cogan and Rector Jr (1982) demonstrated that proximal volume reabsorption is reduced during hyperchloremic metabolic acidosis using free-flow micropuncture techniques in rats. They concluded that absolute proximal volume reabsorption during metabolic acidosis and its partial repair correlates with the absolute magnitude of bicarbonate filtered and reabsorbed and that proximal volume reabsorption may be regulated, at least in part, by the anion composition of the glomerular ultrafiltrate. Wang and Egbert et al. (1998) showed that inhibiting NaCl transport, regardless of the stimulation of bicarbonate transport, in the in situ microperfused proximal tubule of rat. They concluded that decreased NaCl transport is due, at least, in part to the decrease in organic anion-dependent NaCl transport.
(2) Respiratory acidosis
Dorman PJ, J Sullivan and RF Pitts (1954) showed that in whole-dog experiments, acute respiratory acidosis results in enhanced renal reabsorption of bicarbonate-bound base, and that elevated CO2 tension (PaCO2) of bodily fluids rather than lowered pH is primarily responsible for this increase. Additionally, they found that bicarbonate bound base is reabsorbed by ion exchange. However, because this study was performed in whole dog, the situation was not suitable for our experiments.
Levine DZ (1971) performed micropuncture experiments in rats. He described that the present investigations were undertaken to characterize the influence of acute hypercapnia on bicarbonate and water transport of rat proximal tubules. He showed that acute hypercapnia 1) increases fractional water and bicarbonate reabsorption in ringer-infused animals, 2) increases absolute net reabsorptive rates for bicarbonate (without reference to single-nephron GFR) in only the bicarbonate-infused rats, and 3) does not alter absolute net reabsorptive rates for water in either group.
Madias, Wolf, and Cohen (1985) showed that the renal response in dogs (augmentation of renal bicarbonate reabsorption) to chronic respiratory acidosis is mediated by factors other than a simple change in systematic pH, some direct consequence of the change in PaCO2.
(3) High K+ in basolateral solution
Brandis, Keyes and Windhager (1972) showed that the direct inhibitory effect of increased K+ concentrations in peritubular fluid on proximal tubular sodium reabsorption in free-flow micropuncture recollections study. They concluded that a nearly linear inverse relationship between potassium concentration in capillary fluid and tubular reabsorption rate was found.
(4) Low sodium in the basolateral solution
We could not find any published studies that have investigated low sodium conditions in proximal tubules. However, several studies have been published that investigated low sodium basolateral solutions in frog skin (Tayler and Windhager (1979), Grinstein S and D Erlij (1977)). Sodium transport was inhibited by a low sodium bathing solution.
(5) Summary
As shown in Table 10, cellular alkalinization (or an increase of cellular Ca2+) inhibits Na+ transport in case of ionomycin. In respiratory acidosis, cellular acidification directly facilitates Na+ transport. In high K+, cellular alkalinization directly inhibits Na+ transport. We speculate that in these cases, namely ionomycin, respiratory acidosis and high K+, the main site for modulating Na+ transport may be the apical NHE, because of the small changes in Vbl, which means the mechanism for the basolateral side is left intact. In cases of metabolic acidosis, low Na+ and oubain, cellular acidification inhibits Na+ transport. We speculate that in cases of metabolic acidosis, low Na+ and oubain, the main site of modulating Na transport may be Na+/K+ ATPase on the basolateral membrane (Fig. 12).
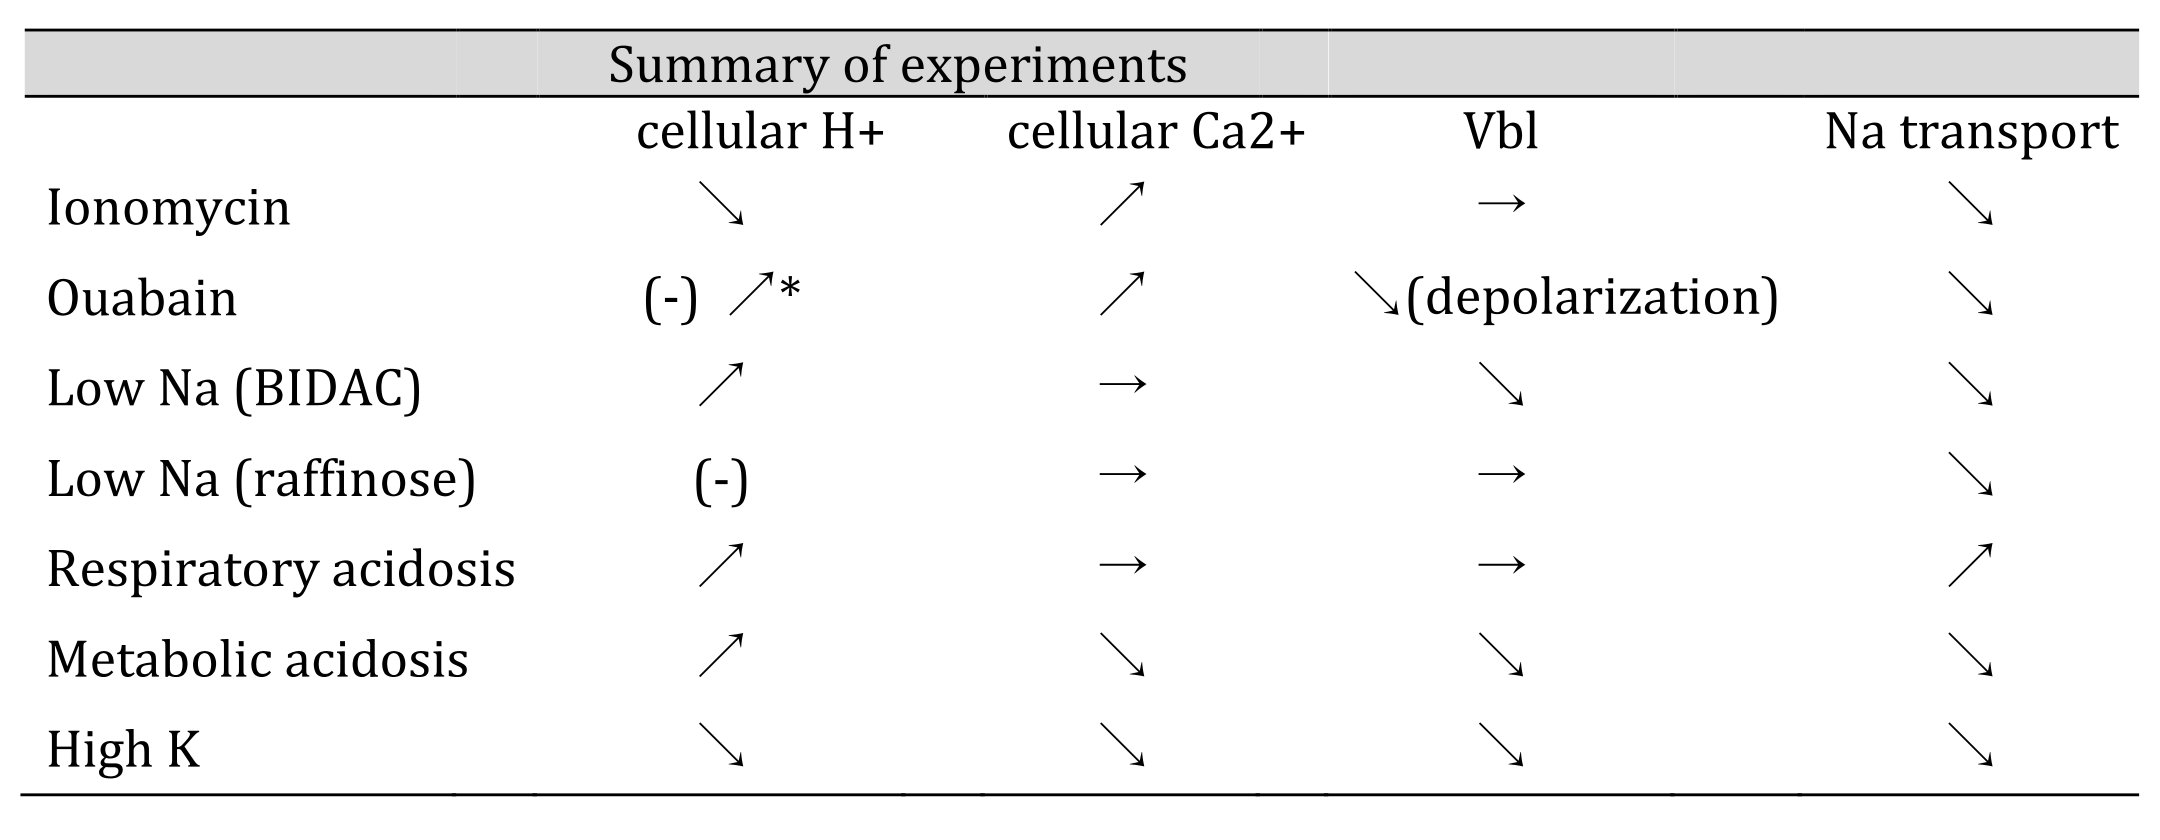
Table 10: Summary of experiments. All experiments except Ca2+ ionophore (ionomycin) appear consistent with the H+ hypothesis. In other words, cellular acidification causes Na+ transport to decrease, and cellular alkalinization causes Na+ transport to increase (as described in the text). *We found cellular acidosis in response to ouabain treatment (Matsumura et al., 1985; Fujimoto and Morimoto, 1986). ↗:acidification, increase, hyperpolarization, stimulation. ↘alkalization, decrease, depolarization, inhibition. →:no significant change. Vbl: potential difference across basolateral membrane.
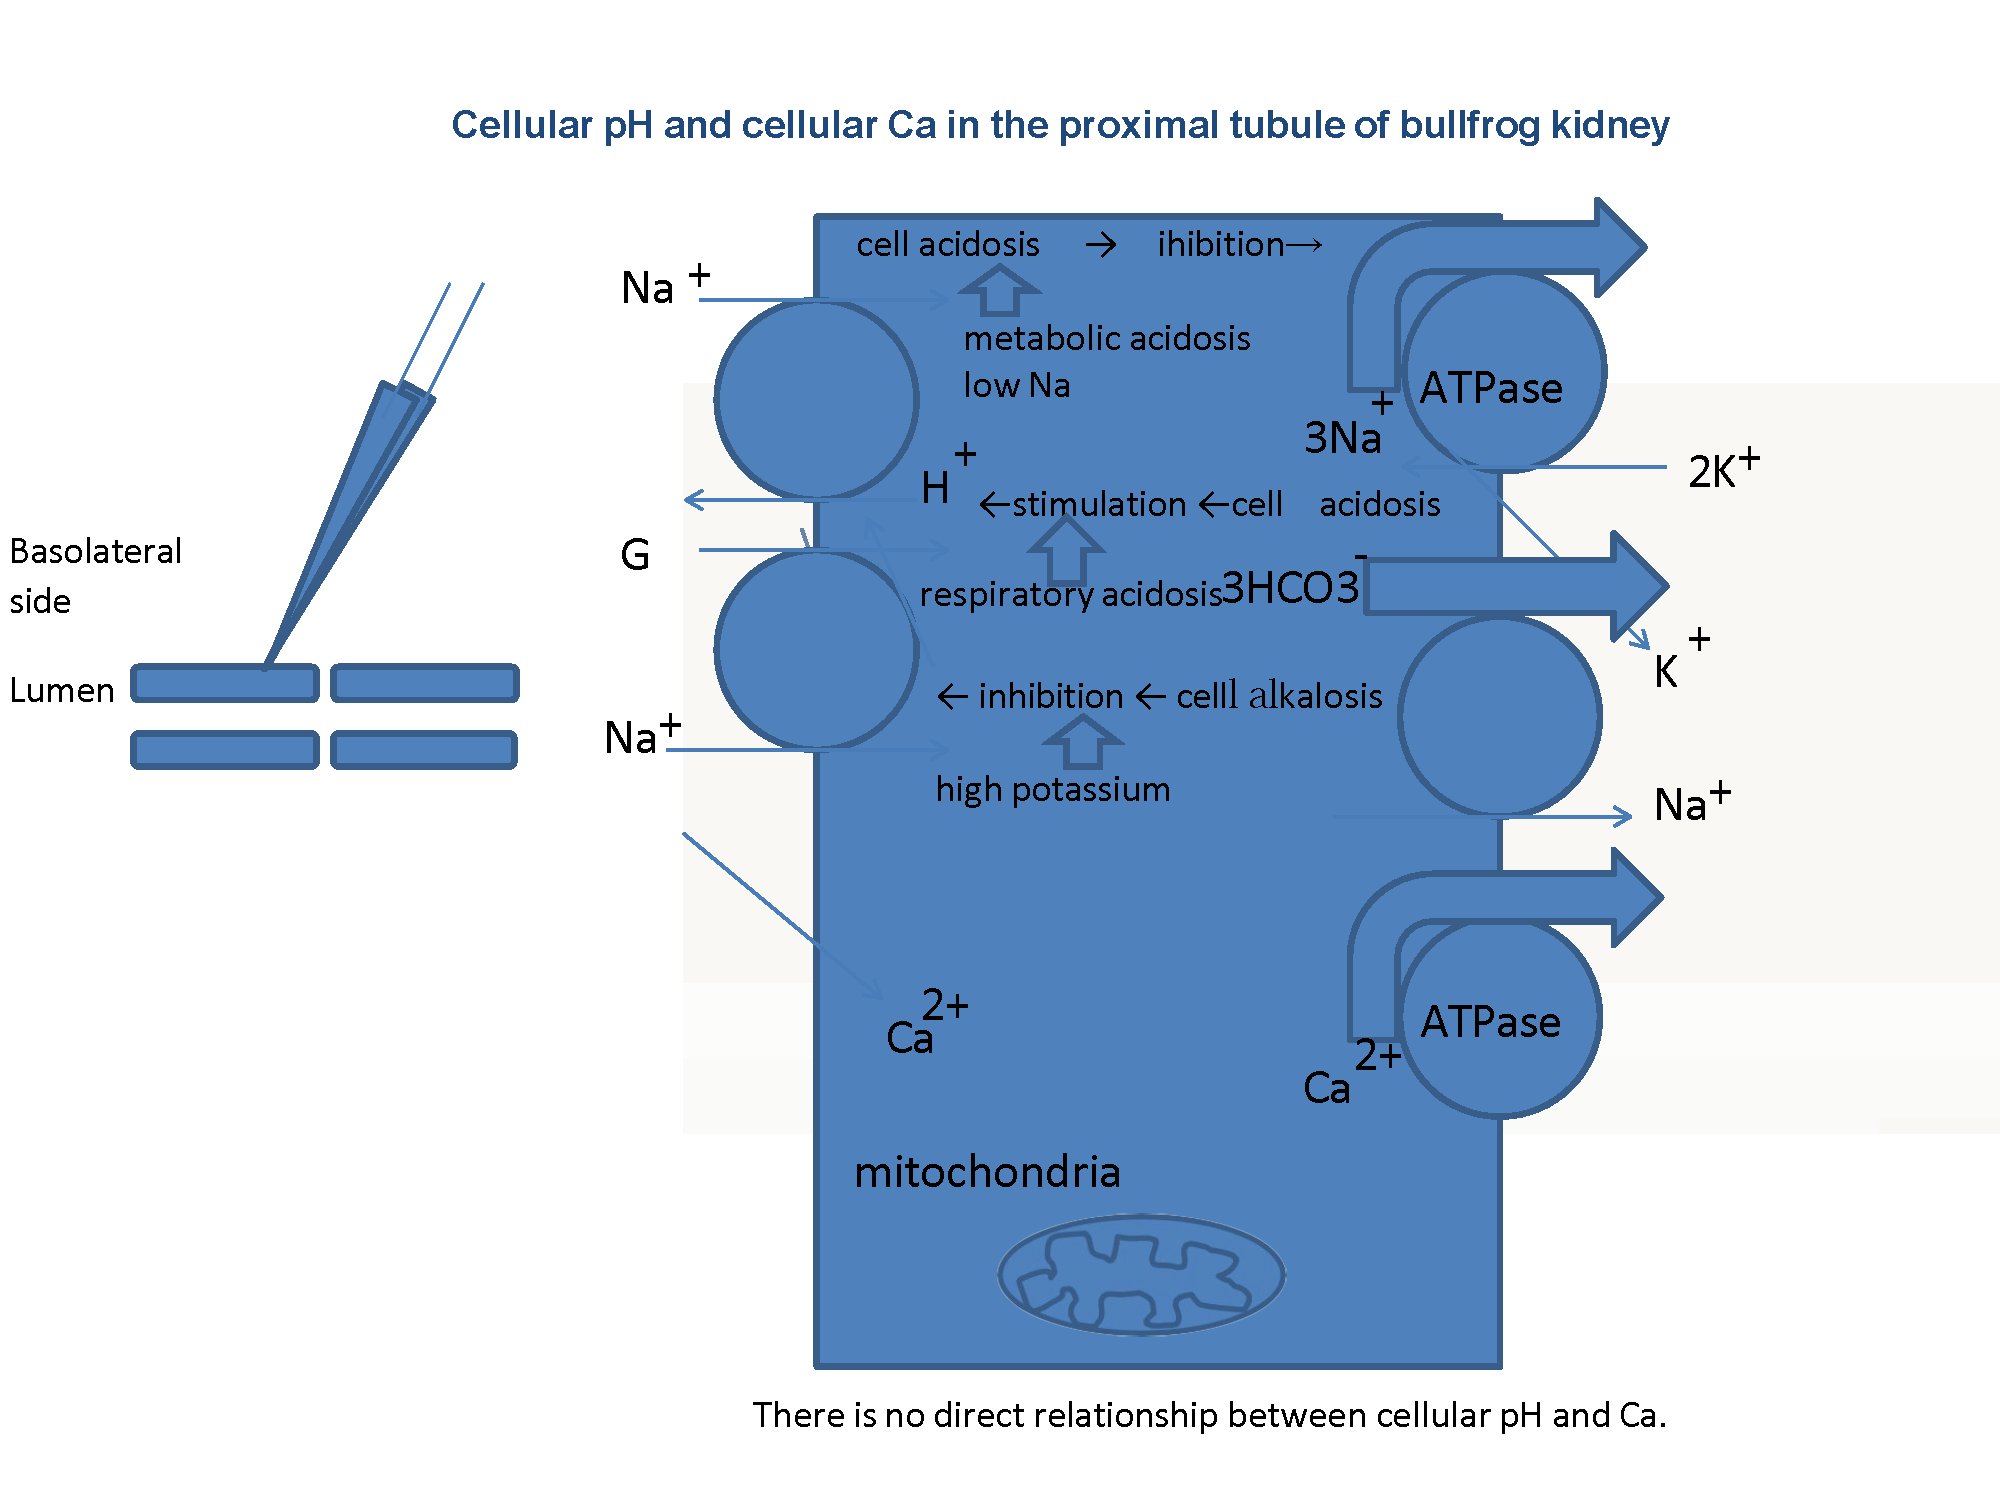
Fig. 12: Summary. There is no Na+/Ca2+ exchanger (NCX) in basolateral membranes of the proximal tubule. We speculated that either cellular acidosis caused by metabolic acidosis or low Na+ inhibits the Na+/K+ ATPase, that cell acidosis caused by respiratory acidosis stimulates the Na+/H+ exchanger in the apical membrane, and that cellular alkalosis caused by high K+ inhibits the Na+/H+ exchanger in the apical membrane. In our experiments, luminal solutions were not changed and the same control solutions were used. Our speculation must be confirmed experimentally.
Possibility of linkage of K conductance and HCO3 conductance (Na-dependent) and Na/K-ATPase across basolateral membranes
In this regard, modulators of Na+/K+ ATPase and K+ conductance include cell swelling, ATP, PD, Ca2+, pH, and NO (Malnic et al. (2013), in Fig. 49.6). In addition, in oocytes, with the elevation of cytosolic calcium concentration, there was relatively slow (30 s) activation of NBC conductance (Na–HCO3 cotransporter), plus a shift in stoichiometry from 2:1 to 3:1 (Mueller-Berger et al. (2001)). The addition of cAMP caused a shift in stoichiometry from the basal 3:1 to 2:1 (Gross and Hopfer (1996)) (for a review, see Weinstein (2013)). At present, it seems that cell Ca and cell pH are primitive ion species for the cell. Although we do not know the mechanism involved (e.g., Ca buffering in mitochondria), cell Ca could not easily change. Cellular Ca has been proposed to modulate RVD (McCarty and O'Neil (1992)). Being readily changed, cell pH might play an important role in the mechanism of transport of Na+ and H+ (HCO3) in the proximal tubule.
The mitochondrial Ca2+ ion transport involved the Ca2+ influx (cytosol to mitochondrial matrix) (uniporter) and Ca2+ efflux (mitochondrial matrix to cytosol) (an electrogenic Ca2+/3Na+ exchanger and Ca2+/2H+ exchanger) (Jung et al., 1995, Scheffler IE. 2009). We could not consider the role of mitochondria in this study.
Cell Ca2+ is maintained in order of nM without NCX.
The free Ca2+ concentration in the cytosol of all cells, plant and microbe, is in the sub-micromolar range (Campbell AK, 2018). The mechanisms for keeping the free Ca2+ in the sub-micromolar level after the cell event (50–100 μM) are the pumps and exchangers, depending on cell type. In the plasma membrane, these include the pumps and exchangers plasma membrane Ca2+-Mg ATPase (PMCA), 3 NCX, 4Na+/Ca2+-K exchanger (NCKX), and Ca2+/H+ exchanger. In addition, there are pumps and exchangers in the sarco-endoplasmic reticulum (SR/ER), golgi and mitochondria which remove some Ca2+ back into the internal store, or are involved in determining the size, location and type of the Ca2+ signal: SR/ER Ca2+-Mg ATPase (SERCA), mitochondrial Ca2+ influx channel, mitochondrial Na+ activated Ca2+ efflux and golgi Ca2+-MgATPase (SPCA).
According to the Campbell's description (Campbell, 2018), the kinetic properties of the PMCA are well suited to maintaining the low cytosolic concentration of free Ca2+ found in many cells. The faster kinetic properties of NCX, with the SERCA pump, make it well suited to restoring the cytosolic concentration of free Ca2+ to sub-micromolar levels after a heart beat or in a nerve terminal after an action potential.
From our work, we may conclude that the proximal tubules contain cells without NCX while the distal and connecting tubules (Jeon US, 2008) contain cells with NCX.
Clinical implications of this finding
The first implication is a more precise understanding of acid-base balance and Na+ transport at the single -nephron level across the basolateral membrane of proximal tubules. We also found that Na+ transport and acid-base balance have been discussed without considering cellular Ca2+ activity (Moe OW et al. (1990), Curthoys NP and OW Moe (2014) and DZ Levine (1990)).
The second implication is reconsideration of the involvement of NCX in cell death caused by recirculation after the delivery of blood to the kidneys has been stopped. Bonventre JV et al. (1998) said that the last (S3) segment of the proximal tubule and the medullary thick ascending limb (MTAL) are both located in the kidney’s outer medulla. Moreover, this region of the kidney is marginally oxygenated under normal circumstances and suffers the most severe and persistent hypoxia after an ischemic insult because the restoration of blood flow to this region is delayed. Bonventre JV & L Yang (2011) described that epithelial cell damage associated with ischemia/reperfusion injury (IRI) is most apparent in the S3 segment of the proximal tubule in most animal models and that tubular cell damage and death occurs due to apoptosis or necrosis, if not both.
According to Bonventre & Yang, ischemia results in rapid loss of cytoskeletal integrity and cell polarity, and shedding of the proximal tubule brush border occurs; loss of polarity with mislocalization of adhesion molecules and other membrane proteins such as the Na+/K+ ATPase and β-integrins; cytokine-induced disruption of cell-cell interactions at adherent and tight junctions, and that actin localization changes from the apical to the lateral cell membrane. Rana A et al. (2001) reported that cells dying by necrosis become rapidly swollen (oncosis), that the mitochondria become progressively enlarged in short order, and that the normal invagination of mitochondrial cristae is lost. They also said that in the final stages of necrosis, the cell’s plasma membrane disintegrates and cytosolic contents leak from the cell, causing inflammatory reaction and injury to surrounding cells. However, they said, cells undergoing apoptosis become progressively smaller in distinct contrast to necrotic cells and rapidly lose cell-cell and cell-matrix adhesion. They added that another distinct feature of apoptosis is that plasma membrane remains structurally intact and that laddering of DNA is a highly reliable apoptosis marker.
They showed in their review paper (Rana A et al., 2001) that severe cell injury causes profound depletion of cellular ATP stores, which resulted in reduced activity of energy-requiring sodium and calcium membrane pumps and increased production of reactive oxygen species (ROS) from mitochondria. Increased cytosolic Na+ and water causes cell swelling while increased cytosolic concentration of free Ca2+ causes activation of proteases and endonuclease activation, which resulted in nuclear degradation. The increase in free calcium also causes activation of phospholipases, which results in both plasma membrane injury and in mitochondrial injury and dysfunction. Thereafter, increased ROS production causes oxidant injury to lipid bilayers, thus leading to both plasma membrane injury and mitochondrial swelling.
Apoptosis was divided into two phases, commitment (kinases, Bcl-2 family proteins, NF-kB, inhibitors of apoptosis (IAPS)) and execution (activation of caspases). According to Rana A et al. (2001), mitochondrial events are among the earliest in the execution of apoptosis, and events such as the release of cytochrome c into the cytosol may in fact represent a “point of no return” in the cell’s decision to undergo apoptosis.
Vonbrunn E et al. (2023) showed the importance of complement activation in mediating ischemia, reperfusion injury (IRI), and kidney transplantation. The C5a/C5aR1 axis has been shown to be critically involved in mediating renal I/R injury.
Methods
There are problems concerning the methods.
1. Single- and double-barreled microelectrodes
Double-barreled microelectrodes are difficult to fabricate and insert into cells. However, using them, we can measure the activity of each ion and membrane PD in the same cell. The levels of cellular damage caused by insertion into cells are the same between the output of the ion-selective barrel and that of the reference barrel.
A single ion-selective microelectrode was inserted into the cell, and then another conventional microelectrode was inserted into a cell nearby. It is assumed that both cells behave in the same manner. The presence of cell–cell coupling made this possible. However, this assumption would be unlikely if cell–cell coupling was blocked. Moreover, cell–cell coupling closes in response to acidosis but not to a change in aCai (Matsumura et al., 1986).
2. Ca activity coefficient
The Ca activity (aCa) is Ca concentration ([Ca]) multiplied by activity coefficient (γCa), i.e., aCa = γCa×[Ca]. Estimation of γCa in the physiological range is very difficult. γCa has a much lower value than that of Na or K. Some researchers (Fujimoto et al., 1989; Lorenzen et al., 1982) adopted 0.35 for γCa, but we could not accept this value. Instead, we used 0.38 as the Ca activity coefficient, in accordance with Moore and Ross (1965) and Khan et al. (2016). The Ca ion–selective microelectrode responds to Ca activity, not Ca concentration. We assumed γCa in the calibration of the Ca ion–selective microelectrode. Here, we made two assumptions: 1) γCa must be the same among extracellular fluids and intracellular fluids; and 2) γCa in calibration solutions must be the same as γCa in physiological solutions. Thomas recommended the Ca concentration ([Ca]), and Alvarez-Leefmass et al. (1981) and Marban et al. (1980) adopted Ca concentration ([Ca]) instead of aCa, which they used for Ca microelectrodes.
3. Detection limit
Ammann et al. (1987) used an electrically neutral carrier, ETH129, in a single-barreled microelectrode front-filled with a membrane phase containing PVC [poly(vinyl chloride)]. They reported an improved detection limit, 10−9.2 M, relative to that of the widely used ETH1001. However, we used ETH1001 in this study. Tsien and Pozzan (1989) used quin2, with had a detection limit of 10−8 M. They also recommended fura-2 and indo-1 for direct measurement of the heterogeneity within a cell. Nakai et al. (2001) developed a high signal-to-noise Ca probe, G-CaMP, to improve the detection limit.
4. Cell swelling
In the presence of 10−5 M ouabain, cells were swollen. Cell volume regulation must be involved with the cell. The solution must be changed in a short period of time. Cell volume regulation (cell swelling) can be achieved via an increase in the efflux of KCl (regulatory volume decrease, RVD) (Aronson et al., 2017; Strange, 2004; Lang et al., 1998; McCarty and O'Neil, 1992; Sarkadi and Parker, 1991; Mongin and Orlov, 2001).
5. Transient solution change
However, substitution experiments must be performed quickly and thoroughly, allowing the cell to recover completely. In ionomycin and ouabain treatments, complete recovery is not expected because of cell damage. In our system, the exchange rate (t1/2) of the solution was calculated to be 10.3 sec. We could not consider the role of the active H+ pump and the active Ca2+ pump.
6. Paracellular pathway
We do not have any knowledge about the contribution of the paracellular pathway in our experiments. However, Na+, K+, Ca2+, and Cl− are believed to move via the paracellular pathway.
7. CO2 and HCO3 buffer system
Assuming high CO2 permeability of the cell membrane, and given that H+ + HCO3− →←H2O +CO2 (catalyzed by carbonic anhydrase), the renal proximal tubule should have an additional shunt pathway other than HCO3 ion migration via the NBC; the presence of such a pathway in the proximal tubule has been confirmed multiple times. This CO2 shunt pathway will be silent with regard to electrical properties.
8. We could not carry out the experiments with NCX inhibitors (Iwamoto T, 2004, Kohajda. Z. et al., 2016).
Conclusion
We concluded that the basolateral membrane of the proximal tubule contains either an NBC or an NCX and that there is no direct relationship between cellular pH and cellular Ca2+. There are limitations to this conclusion because of the direction of pH changes; ionomycin caused cellular alkalinization and low Na+ (BIDAC) caused cellular acidification. Thus, Na+ transport was inhibited by the increase in Ca2+ due to ionomycin and by acidification caused by low Na+ (BIDAC) and ouabain. Our results suggest that the inhibition of Na+ transport occurred by cellular acidification instead of the increase in intracellular Ca2+ activity except ionomycin.
Acknowledgements
We thank G. Giebisch and M. Fujimoto for their support. The work reported here was performed in the Department of Physiology, Osaka Medical College (Takatsuki city, Osaka, Japan). We also thank Edanz (https://en- auther-services.edanzgroup.com/ac) and Zenis (twice) (https://www.zenis.co.jp) for editing the English text of a draft of this manuscript. We thank S. Matsumura for advice during preparation of the draft manuscript.
Funding
This work was supported by JSPS KAKENHI (Grant Number JP 6077009 to YM) and by Osaka Kidney Foundation (OKF86-0017 to YM).
Availability of data and materials
Datasets used and analyzed in this study are available from the corresponding author upon reasonable request.
Ethics approval and consent to participate
All protocols involving animals were in compliance with the Animal Research: Reporting of In vivo Experiments (ARRIVE) guidelines.
Consent for publication
Not applicable
Disclosure Statement
The author declares that he has no competing interests.
References
| 1 | Zhuo JL, Li XC: Proximal nephron. Compr Physiol 2013;3:1079-1123.
https://doi.org/10.1002/cphy.c110061 |
| 2 | Lee,CO, Tayler A, Windhager EE: Cytosolic calcium ion activity in epithelial cells of Necturus kidney. Nature London 1980;287.
https://doi.org/10.1038/287859a0 |
| 3 | Friedman PA, Figueiredo JF, Maack T, Windhager EE: Sodium-calcium interactions in the renal proximal convoluted tubule of the rabbit. Am J Physiol 1981;240:558-568
https://doi.org/10.1152/ajprenal.1981.240.6.F558 |
| 4 | Lorenzen M, Lee CO, Windhager EE: Cytosolic Ca2+ and Na+ activities in perfused proximal tubules of Necturus kidney. Am J Physiol 1984;247:93-102.
https://doi.org/10.1152/ajprenal.1984.247.1.F93 |
| 5 | Yang JM, Lee CO, Windhager EE: Regulation of cytosolic free calcium in isolated perfused proximal tubules of Necturus. Am J Physiol 1988;255:787-799.
https://doi.org/10.1152/ajprenal.1988.255.4.F787 |
| 6 | Dominguez JH, Rothrock JK, Macias WL, Price J: Na+ electrochemical garadient and Na+-Ca2+ exchange in rat proximal tubule. Am J Physiol 1989;257:531-538.
https://doi.org/10.1152/ajprenal.1989.257.4.F531 |
| 7 | Dominiguez JH., Mann C, Rothrock JK, Bhati V: Na+-Ca2+ exchange and Ca2+ depletion in rat proximal tubules. Am J Physiol Renal Physiol 1991;261:328-335.
https://doi.org/10.1152/ajprenal.1991.261.2.F328 |
| 8 | Mandel LJ, Murphy E: Regulation of cytosolic free calcium in rabbit proximal renal tubules. J Biol Chem 1984;259:11188-11196.
https://doi.org/10.1016/S0021-9258(18)90845-8 |
| 9 | Fujimoto M, Kubota T, Hagiwara N, Kubokawa M, Ohno-Shosaku T, Kotera K.: Relationship between cytosolic activities of calcium and pH in frog proximal tubules. Jpn J Physiol 1989;39:273-296.
https://doi.org/10.2170/jjphysiol.40.273 |
| 10 | Dominiguez JH, Juhaszova M, Feister HA: The renal sodium-calcium exchanger. J Lab Clin Med 1992;119:640-649.
|
| 11 | Ramachandran C, Brunette MG: The Na+/Ca2+ exchange system is located exclusively in the distal tubule. Biochem J 1989;257:259-264.
https://doi.org/10.1042/bj2570259 |
| 12 | Yu SA, Hebert SC, Lee SL, Brenner BM, Lytton J: Identification and localization of renal Na+-Ca2+ exchanger by polymerase chain reaction. Am J Physiol 1992;263:680-685.
https://doi.org/10.1152/ajprenal.1992.263.4.F680 |
| 13 | Lee GS, Choi KC, Jeung EB: K+-dependent Na+/Ca2+ exchanger 3 is involved in renal active calcium transport and is differentially expressed in the mouse kidney. Am J Physiol Renal Physiol 2009;297:371-379.
https://doi.org/10.1152/ajprenal.90615.2008 |
| 14 | Reilly RF, Shugrue CA, Lattanzi D, Biemesderfer D: Immunolocalization of the Na+/Ca2+ exchanger in rabbit kidney. Am J Physiol 1993;265:327-332.
https://doi.org/10.1152/ajprenal.1993.265.2.F327 |
| 15 | Bourdeau JE, Taylor AN, Iacopino AM: Immunocytochemical localization of sodium-calcium exchanger in canine nephron. J Am Soc Nephrol 1993;4:105-110.
https://doi.org/10.1681/ASN.V41105 |
| 16 | Lytton J, Lee SL, Lee WS, van Baal J, Bindels RJM, Kilav R, Naveh-Many T, Silver J: The kidney sodium-calcium exchanger. Ann NY Acad Sci 1996;58-72.
https://doi.org/10.1111/j.1749-6632.1996.tb44770.x |
| 17 | Yamashita J, Kita S, Iwamoto T, Ogata M, Takaoka M, Tazawa N, Nishikawa M, Wakimoto K, Shigekawa M, Komuro I, Matsumura Y: Attenuation of ischemia/reperfusion-induced renal injury in mice deficient in Na+/Ca2+ exchanger. J Pharm Exp Ther 2003;304:284-293.
https://doi.org/10.1124/jpet.102.039024 |
| 18 | Yang D, Yang D: Role of intracellular Ca2+ and Na+/Ca2+ exchanger in the pathogenesis of contrast-induced acute kidney injury. BioMed Research International 2013;Article ID 678456, 5 pages.
https://doi.org/10.1155/2013/678456 |
| 19 | Parker MD, Myers EJ, Schelling JR: Na+-H+ exchanger-1 (NHE1) regulation in kidney proximal tubule. Cell Mol Life Sci 2015;72:2061-2074.
https://doi.org/10.1007/s00018-015-1848-8 |
| 20 | Despa S, Islam MA, Pogwizd SM, Bers DM: Intracellular [Na+] and Na+ pump rate and rabbit ventricular myocytes. J Physiol 2002;539.1:133-143.
https://doi.org/10.1113/jphysiol.2001.012940 |
| 21 | Garciarena CD , Ma YL, Swietach P, Huc L, Vaughan-Jones RD:. Sarcolemmal localization of Na+-HCO3- co-transport influences the spatial regulation of intracellular pH in rat ventricular myocyte. J Physiol 2013;591.9:2287-2306.
https://doi.org/10.1113/jphysiol.2012.249664 |
| 22 | Taylar A, Windhager EE: Possible role of cytosolic calcium and Na-Ca exchange in regulation of transepithelial sodium transport. Am J Physiol 1979;236:505-512.
https://doi.org/10.1152/ajprenal.1979.236.6.F505 |
| 23 | Boron W, Boulpaep EL: Intracellular pH regulation in the renal proximal tubule of the salamander: Basolateral HCO3- transport. J Gen Physiol 1983;81:53-94.
https://doi.org/10.1085/jgp.81.1.53 |
| 24 | Harvey BJ, Ehrenfeld J: Role of Na+/H+ exchange in the control of intracellular pH and cell membrane conductances in frog skin epithelium. J Gen Physiol 1988;92:793-810.
https://doi.org/10.1085/jgp.92.6.793 |
| 25 | Fujimoto M, Morimoto Y: Control of intercellular pH in the proximal tubule of amphibian kidney. Biomed Res 1986;7:187-188.
|
| 26 | Holz PH: The reptilian renal portal system-A review. Bulletin of the association of reptilian and amphibian veterinarians 1999;9:4-14.
https://doi.org/10.5818/1076-3139.9.1.4 |
| 27 | Tamura K, Akutsu T: The mode of blood flow in the frog or toad's kidney. Proceedings of the Imperial Academy 1930;6:379-380.
https://doi.org/10.2183/pjab1912.6.379 |
| 28 | Ohtani O, Naito I: Renal microcirculation of the bullfrog, Rana catesbeiana. A scanning electron microscope study of vascular casts. Arch Histol Jap 1980;43: 319-330.
https://doi.org/10.1679/aohc1950.43.319 |
| 29 | Fujimoto M, Kubota T: Physicochemical properties of a liquid ion exchanger microelectrode and its application to biological fluids. Jap J Physiol 1976;26:631-650.
https://doi.org/10.2170/jjphysiol.26.631 |
| 30 | Oehme J, Kessler M, Simon W: Neutral carrier Ca2+-microelectrode. Chimia Aarau 1976;30:204-206.
|
| 31 | Kielland J: Individual activity coefficients of ions in aqueous solutions. J Amer Chem Soc 1937;59:1675-1678.
https://doi.org/10.1021/ja01288a032 |
| 32 | Rose BD, Post TW: Chapter 10 Acid-base physiology in Clinical physiology of acid-base and electrolyte disorders, ed fifth,McGraw-Hill, pp299-324,2001.
|
| 33 | Kajino, K., Matsumura Y, Fujimoto M: Determination of dissociation exponent of CO2 used in Henderson-Hasselbalch equation by means of bicarbonete-selective microelectrode. Nihon Seirigaku Zasshi. Journal of the Physiological Society of Japan 1981;44:663-673.
|
| 34 | Bates RJ: Determination of pH. Theory and Practice,John Wiley & Sons, Inc. ,New York,1973.
|
| 35 | Mueller-Berger S, Ducoudret O, Diakov A, Froemter E: The renal Na-HCO3-co-transporter expressed in Xenopus laevis oocytes: change in stoichiometry in response to elevation of cytosolic Ca concentration. Pfluegers Arch 2001;442:718-728.
https://doi.org/10.1007/s004240100592 |
| 36 | Kajino K, Fujimoto M: Intracelluarmeasurement of Na activity using neutral carrier Na ion-selective microelectrode. Jpn J Physiol 1982;32:997-1001.
https://doi.org/10.2170/jjphysiol.32.997 |
| 37 | Cemerikic D, Giebisch G: Intracellular Na activity measurements in Necturus kidney proximal tubule. 8th Int. Congr Nephrol 1981;Athens, Abstract,p.71.
|
| 38 | Guggino WB, Windhager EE, Boulpaep EL, Giebisch G: Cellular and paracellular resistances of the Necturus proximal tubule. J Membr Biol 1982;67:143-154.
https://doi.org/10.1007/BF01868657 |
| 39 | Matsumura Y, Aoki S, Fujimoto M: Regulatory mechanism of cell pH in the renal proximal tubule of bullfrog nephron. Jpn J Physiol 1985;35:741-763.
https://doi.org/10.2170/jjphysiol.35.741 |
| 40 | Thomas RC: The role of bicarbonate、chloride and sodium ions in the regulation of intracellular pH in snail neurones. J Physiol 1977;273:317-338.
https://doi.org/10.1113/jphysiol.1977.sp012096 |
| 41 | Oberleithner H, Guggino W, Giebisch G: Mechanism of distal tubular chloride transport in Amphiuma kidney. Am J Physiol 1982;242:331-339.
https://doi.org/10.1152/ajprenal.1982.242.4.F331 |
| 42 | Gyoery AZ. Kweifio-Okai G,Ng J: Hypo- and hyperosmolal saline and raffinose on kidney cortical cell volume at 37 degrees C. Am J Physiol 1981;240:180-184.
https://doi.org/10.1152/ajprenal.1981.240.3.F180 |
| 43 | Lopes AG. Guggino WB: Volume regulation in the early proximal tubule of the Necturus kidney. J Mem Biology 1987;97:117-125.
https://doi.org/10.1007/BF01869418 |
| 44 | Haeussiner D. Stehle T, Lang F: Volume regulation in liver: further characterization by inhibitors and ionic substitutions. Hepatol 1990;11:243-254.
https://doi.org/10.1002/hep.1840110214 |
| 45 | Welling PA, O'Neil RG: Ionic conductive properties of rabbit proximal straight tubule basolateral membrane. Am J Physiol Renal Physiol 1990;258:940-95046.
https://doi.org/10.1152/ajprenal.1990.258.4.F940 |
| 46 | Beck JS, Breton S, Giebisch G, Laprade R: Potassium conductance regulation by pH during volume regulation in rabbit proximal convoluted tubules. Am J Physiol Renal Physiol 1992;263:453.
https://doi.org/10.1152/ajprenal.1992.263.3.F453 |
| 47 | Dousa TP: Effects of hormones on cyclic AMP formation in kidney of nonmammalian vertebrates. Am J Physiol 1974;226:1193-1197.
https://doi.org/10.1152/ajplegacy.1974.226.5.1193 |
| 48 | Yoshimura h, Yata M, Yuasa M, Wolbach RA: Renal regulation of acid-base balance in the bullfrog. Am J Physiol 1961;201:980-986.
https://doi.org/10.1152/ajplegacy.1961.201.6.980 |
| 49 | Wilkinson HL, Deeds DG, Sullivan LP, Welling DJ: Effects of ouabain on potassium transport in the perfused bullfrog kidney. Am J Physiol 1979;236:175.
https://doi.org/10.1152/ajprenal.1979.236.2.F175 |
| 50 | Lang F, Messner G, Wang W, Paulmichl M, Oberleithner H, Deetjen P: The influence of intracellular sodium activity on the transport of glucose in proximal tubule of frog kidney. Pflügers Arch 1984;401:14-21.
https://doi.org/10.1007/BF00581527 |
| 51 | Kelepeuris K, Agus ZS, Civan MM: Intracellular calcium activity in split frog skin epithelium: effect of cAMP. J Membr Biol 1985;88:113-121.
https://doi.org/10.1007/BF01868425 |
| 52 | Matsumura Y, Fujimoto M, Giebisch G: Cell-to-cell coupling in frog renal proximal tubules. Biomed Res 1986;7:141-145.
|
| 53 | Zhao J, Zhou Y, Boron WF: Effect of isolated removal of either basolateral HCO3ー or basolateralCO2 on HCO3ー reabsorption by rabbit S2 proximal tubule. Am J Physiol Renal Physiol 2003;285:359-369.
https://doi.org/10.1152/ajprenal.00013.2003 |
| 54 | Lang F, Messner G, Wang W, Oberleithner H: Interaction of intracellular electrolytes and tubular transport. Klinische Wochenschrift 1983;61:1029-1037.
https://doi.org/10.1007/BF01537501 |
| 55 | Wang W, Messner G, Oberleithner H, Lang F, Deetjen P: The effect of ouabain on intracellular activities of K+, Na+, Cl, H+ and Ca2+ in proximal tubules of frog kidneys. Pfluegers Arch 1984;401:6-13.
https://doi.org/10.1007/BF00581526 |
| 56 | Guggino WB, Oberleithner H, Giebisch G: Relationship between cell volume and ion transport in the early distal tubule of the Amphouma kidney. J Gen Physiol 1985;86:31-58.
https://doi.org/10.1085/jgp.86.1.31 |
| 57 | Sackin, H, Palmer LG: Electrophysical analysis of transepithelial transport. Pp 177-216. In Seldin and Giebisch's The Kidney and Pathophysiology, ed Fifth. edited by RJ Alpern, MJ.Caplan, and OW Moe. Academic Press, Chap 7, Pp177-216,2013.
https://doi.org/10.1016/B978-0-12-381462-3.00007-0 |
| 58 | Maunsbach AB, Vorun H, Kwon T, Nielsen S, Simonsen B, Choi I, Schmitt B, Boron WF, and Aalkjær C: Immunoelectron microscopic localization of the electrogenic Na/HCO3 cotransporter in rat and ambystoma kidney. J Am Soci Nephrol 2000;11:2179-2189.
https://doi.org/10.1681/ASN.V11122179 |
| 59 | Schmitt BM, Biemesderfer D, Romero MF, Boulpaep EL, Boron WF: Immunolocalization of the electrogenic Na+-HCO3 cotransporter in mammalian and amphibian kidney. Am J Physiol 1999;275:27-36.
https://doi.org/10.1152/ajprenal.1999.276.1.F27 |
| 60 | Abuladze N, Lee I, Newman D, Hwang J, Pushkin A, Kurtz I: Axial heterogeneity of sodium-bicarbonate cotransporter expression in the rabbit proximal tubule. Am J Physiol 1998;274:628-633
https://doi.org/10.1152/ajprenal.1998.274.3.F628 |
| 61 | Giebisch G, Windhager EE, Aronson PS: Transport of acids and bases. In Medical Physiology edited by WF Boron and EL Boulpaep. Pp.821-835,2017.
|
| 62 | Arruda JAL, Dytko G, Talor Z: Stimulation of H+ secretion by CO2 in turtle bladder: role of intracellular pH, exocytosis, and calcium. Am J Physiol 1990;258:222-231.
https://doi.org/10.1152/ajpregu.1990.258.1.R222 |
| 63 | Liu J, Xie Z: The sodium pump and cardiotonic steroids-induced signal transduction: protein kinases and calcium signaling microdomain in regulation of transporter trafficking. Biochem Biophys Acta 2010;1802:1237-1245.
https://doi.org/10.1016/j.bbadis.2010.01.013 |
| 64 | Yan Y, Haller S, Shapiro A, Malhotra N, Tian J, Xie Z, Malhotra D, Shapiro JI, Liu J : Ouabain-stimulated trafficking regulation of the Na/K-ATPase and NHE3 in renal proximal tubule cells. Mol Cell Biochem 2012;367:175-183.
https://doi.org/10.1007/s11010-012-1331-x |
| 65 | Cai H, Wu L, Qu W, Malhotra D, Xie Z, Shapiro Ji, Liu J: Regulation of apical NHE3 trafficking by oubain-induced activation of the basolateral Na+-K+ATPase receptor complex. Am J Physiol 2008;294:555-563.
https://doi.org/10.1152/ajpcell.00475.2007 |
| 66 | Liu J, Xie Z.:The sodium pump and cardiotonic steroids-induced signal transduction: protein kinases and calcium signaling microdomain in regulation of transporter trafficking. Biochem Biophys Acta 2010;1802:1237-1245.
https://doi.org/10.1016/j.bbadis.2010.01.013 |
| 67 | Brackett Jr NC, Cohen JJ, Schwartz WB: Carbon dioxide titration curve of normal man: effect of increasing degrees of acute hypercapnia on acid-base equilibrium. N Engl J Med 1965;272:6-12.
https://doi.org/10.1056/NEJM196501072720102 |
| 68 | Cogan MG: Chronic hypercapnia stimulates proximal bicarbonate reabsorption in the rat. J Clin Invest 1984;74:1942-1947.
https://doi.org/10.1172/JCI111614 |
| 69 | Krapf R: Mechanism of adaptation of chronic respiratory acidosis in the rabbit proximal tubule. J Clin Invest 1989;83:890-896.
https://doi.org/10.1172/JCI113973 |
| 70 | Ruiz OS, Arruda JA, Talor Z: Na+-HCO3- cotransporter and Na-H antiporter in chronic respiratory acidosis and alkalosis. Am J Physiol 1989;206:414-420.
https://doi.org/10.1152/ajprenal.1989.256.3.F414 |
| 71 | Northrup TE, Gallera S, Perticucci E, Cohen JJ: Acidemia alone does not stimulate rat renal Na+ - H+ antiporter activity. Am J Physiol 1988;255:237-243.
https://doi.org/10.1152/ajprenal.1988.255.2.F237 |
| 72 | Madias NE, Wolf CJ, Cohen JJ: Regulation of acid-base equilibrium in chronic hypercapnia. Kidney Int 1985;27:538-543.
https://doi.org/10.1038/ki.1985.44 |
| 73 | Haeussinger D, Grok W: Hepatocyte heterogeneity in ammonia metabolism. Chem Biol Intenact 1984;48:191-194.
https://doi.org/10.1016/0009-2797(84)90120-0 |
| 74 | Cogan MG, Rector Jr FC: Proximal reabsorption during metabolic acidosis in the rat. Am J Physiol 1982;242:499-507.
https://doi.org/10.1152/ajprenal.1982.242.5.F499 |
| 75 | De Sousa RC, Harrington JT, Ricanati ES, Skelrot JW, Schwartz WB: Renal regulation of acid-base equilibrium during chronic administration of acid. J Clin Invest 1974;53:465-476.
https://doi.org/10.1172/JCI107580 |
| 76 | Levine DL, Chou SY, Ferder LF, Liebman PH, Porush JG: The effect of plasma bicarbonate levels on proximal tubule sodium reabsorption in NH4Cl-loaded dogs. J Clin Lab Med 1976;87:804-812.
|
| 77 | Mahnensmith R, Their SO, Cook CR, Broadus A, DeFronzo RA: Effect of acute metabolic acidemia on renal electrolyte transport in man. Metabolism 1978;28: 831-842.
https://doi.org/10.1016/0026-0495(79)90210-5 |
| 78 | Wang T, Egbert AL, Aronson PS, Giebisch G: Effect of metabolic acidosis on NaCl transport in the proximal tubule. Am J Physiol 1998;274:1015-1019.
https://doi.org/10.1152/ajprenal.1998.274.6.F1015 |
| 79 | Ambuhl PM, Amemiya M, Danczkay M, Lotscher M, Kaissling B, Moe OW, Preisig PA, Alpern RJ: Chronic metabolic acidosis increases NHE3 protein abundance in rat kidney. Am J Physiol 1996;271:917-925.
https://doi.org/10.1152/ajprenal.1996.271.4.F917 |
| 80 | Booth BE, Tsai HC, CurtisMorris Jr R: Metabolic acidosis in vitamin D-deficient chick. Metabolism 1977;26:1099-1105.
https://doi.org/10.1016/0026-0495(77)90036-1 |
| 81 | Wiederseiner JM, Muser J, Lutz T, Hulter HN, Kropf R: Acute metabolic acidosis :characterization and diagnosis of the disorder and the plasma potassium response. J Am Soc Nephrol 2004;15:1589-1596.
https://doi.org/10.1097/01.ASN.0000125677.06809.37 |
| 82 | Brandis M, Keyes J, Windhager EE: Potassium-induced inhibition of proximal tubular fluid reabsorption in rats. Am J Physiol 1972;222:421-427.
https://doi.org/10.1152/ajplegacy.1972.222.2.421 |
| 83 | Dorman PJ, Sullivan WJ, Pitts RF: The renal response to acute respiratory acidosis. J Clin Invest 1954;33:82-90.
https://doi.org/10.1172/JCI102874 |
| 84 | Levine DZ: Effect of acute hypercapnia on proximal tubular water and bicarbonate reabsorption. Am J Physiol 1971;221: 1164-1170.
https://doi.org/10.1152/ajplegacy.1971.221.4.1164 |
| 85 | Grinstein S, Erlij D: Intracellular calcium and the regulation of sodium transport in the frog skin. Proc R Soc Lond 1978;B.202:353-380.
https://doi.org/10.1098/rspb.1978.0072 |
| 86 | Malnic G, Giebisch G, Muto S, Wang W, Bailey MA, Satlin LM: Regulation of K+ excretion. In: Seldin, Giebisch. The Kidney, Physiology and Pathophysiology, ed fifth,edited by Alpern RJ, Moe OW, Caplan M, Elsevier:Pp1659-1739,2013.
https://doi.org/10.1016/B978-0-12-381462-3.00049-5 |
| 87 | Gross E, Hopfer U: Activity and stoichiometry of Na+:HCO3 co-transport in immortalized renal proximal tubule cells. J Membr Biol 1996;152:245-252.
https://doi.org/10.1007/s002329900102 |
| 88 | Weinstein AM: Sodium and chloride transport: proximal nephron. In: Seldin, Giebisch. The Kidney, Physiology and Pathophysiology, ed fifth, edited by Alpern RJ, Moe OW, Caplan M, Elsevier: Pp1081-1141,2013.
https://doi.org/10.1016/B978-0-12-381462-3.00033-1 |
| 89 | McCarty NA, O'Neil RG: Calcium signaling in cell volume regulation. Physiol Rev 1992;72:1037-1061.
https://doi.org/10.1152/physrev.1992.72.4.1037 |
| 90 | Jung DW, Baysal K, Brierley GP: The sodium-calcium antiport of heart mitochondria is not electroneutral. J Biol Chem 1995;270:672-678.
https://doi.org/10.1074/jbc.270.2.672 |
| 91 | Scheffler IE: In Mitochondria , ed 2, J Wiley & Sons, New Jersey,2008.
|
| 92 | Campbell AK: In Fundamentals of intracellular calcium. John Wiley and Sons Ltd. :Chap. 5, 2018.
|
| 93 | Jeon US: Kidney and calcium homeostasis. Electrolyte Blood Press 2008;6:68-76.
https://doi.org/10.5049/EBP.2008.6.2.68 |
| 94 | Moe OW, Preisig PA, Alpern RJ: Cellular mode of proximal tubule NaCl and NaHCO3 absorption. Kidney International 1990;38:605-611.
https://doi.org/10.1038/ki.1990.249 |
| 95 | Curthoys NP, Moe OW: Proximal tubule function and response to acidosis. Clin J Am Soc Nephrol 2014;9:1627-1638.
https://doi.org/10.2215/CJN.10391012 |
| 96 | Levine DZ (principal discussant): Single-nephron studies: implication for acid-base regulation. Kidney Int 1990;38:744-761.
https://doi.org/10.1038/ki.1990.267 |
| 97 | Bonventre JV, Brezis M, Siegel N: Acute renal failure. I. Relative importance of proximal vs. distal tubular injury. In: Acute renal failure forum, edited by W Lieberthal and SK Nigam. Am J Physiol 1998;275:623-631.
https://doi.org/10.1152/ajprenal.1998.275.5.F623 |
| 98 | Bonventre JV, Yang Y: Cellular pathophysiology of ischemic acute kidney injury. J Clin Invest 2011;121:4210-4221.
https://doi.org/10.1172/JCI45161 |
| 99 | Rana A, Sathyanarayana P, Lieberthal W: Role of apoptosis of renal tubular cells in acute renal failure: therapeutic implications. Apoptosis 2001;6:83-102.
https://doi.org/10.1023/A:1009680229931 |
| 100 | Vonbrunn E, Bϋtter-Herold M, Amann K, Daniel C: Compliment inhibition in kidney transplantation: where are we now? BioDrugs 2023;37:5-19.
https://doi.org/10.1007/s40259-022-00567-1 |
| 101 | Moore EW, Ross JW: NaCl and CaCl2 activity coefficient in mixed aqueous solutions. J Appl Physiol 1965;20:1332-1336.
https://doi.org/10.1152/jappl.1965.20.6.1332 |
| 102 | Khan MN, Warrier P, Peters CJ, Koh CA: Mean activity coefficient of electrolyte: A critical evaluation of four physical models. J Natural Gas Sci Eng 2016;35:1355-1361.
https://doi.org/10.1016/j.jngse.2016.03.092 |
| 103 | Thomas MV: Physical factors relating to the measurement intracellular free Ca2+. In Techniques in Calcium Research .Academic Press, London. : Chap.2 p32,1982.
|
| 104 | Alvarez-Leefmans FJ, Rink TJ, Tsien RY: Free calcium ions in neurons of Helix Aspersa measured with ion-selective micro-electrodes. J Physiol 1981;315:531-548.
https://doi.org/10.1113/jphysiol.1981.sp013762 |
| 105 | Marban E, Rink TJ, Tsien RW, Tsien RY: Free calcium in heart muscle at rest and during contraction measured with Ca+-selective microelectrodes. Nature 1980;286:845-850.
https://doi.org/10.1038/286845a0 |
| 106 | Ammann D, Buehrer T, Schefer U, Mueller M, Simon W: Intracellular neutral carrier-based Ca2+ microelectrode with subnanomolar detection limit. Pfluegers Arch 1987;409:223-228.
https://doi.org/10.1007/BF00583469 |
| 107 | Tsien R, Pozzan T: Measurement of cytosolic free Ca2+ with quin2. Methods Enzymol 1989;172:230-263.
https://doi.org/10.1016/S0076-6879(89)72017-6 |
| 108 | Nakai J, Ohkura M, Imoto K: A high signal-to-noise Ca2+ probe composed of a single green fluorescent protein. Nat Biotechnol 2001;19:137-141.
https://doi.org/10.1038/84397 |
| 109 | Aronson PS, Boron WF, Boulpaep El.: Transport of solutes and water. In Medical Physiology. ed 3, edited by Boron WF, Boulpaep EL,Philadelphia, PA, Elsevier,: Chapter 5,Pp 102-140,2017.
|
| 110 | Strange K: Cellular volume homeostasis. Adv Physiol Educ 2004;28:155-159.
https://doi.org/10.1152/advan.00034.2004 |
| 111 | Lang F, Busch GL, Ritter M, Voelkl H, Waldegger S, Gulbins E, Haeussinger D: Functional significance of cell volume regulatory mechanisms. Physiol Rev 1998;78:247-306.
https://doi.org/10.1152/physrev.1998.78.1.247 |
| 112 | Sarkadi B, Parker JC: Activation of ion transport pathways by changes in cell volume. Biochim Biophysic Acta 1991;1071:407-427.
https://doi.org/10.1016/0304-4157(91)90005-H |
| 113 | Mongin AA, Orlov SN: Mechanisms of cell volume regulation. In Physiology and Maintenance, vol. 1 General Physiology, edited by Hammen OOP, Atalay M, Elsevier;Pp130-147,2001.
|
| 114 | Iwamoto T: Forefront of Na+/Ca2+ exchanger studies: molecular pharmacology of Na+/Ca2+ exchange inhibitions. J Pharmacol Sci 2001;96:27-32.
https://doi.org/10.1254/jphs.FMJ04002X6 |
| 115 | Kohajda Z, Farkas-Morvay N, Jost N, Nagy N, Geramipour A, Horvath A, Varga RS, Hornyik T, Corici C, Acsai K, Horvath B, Prorok J, Ӧrdӧg B, Deri S, Toth D, Levijoki J, Pollesello P, Koskelainen T, Otsomaa L, Toth A, Baczko I, Lepran I, Nanasi PP, Papp JG, Varro A, Virag L: The effect of a novel highly selective inhibitor of the sodium/calcium exchanger (NCX) on cardiac arrhythmias in in vitro and in vivo experiments. PLOS ONE 2016;11:e0166041.
https://doi.org/10.1371/journal.pone.0166041 |