Flour Fortification Using Lablab Purpureus Evaluation with a Biosensor
bDepartamento de procesos Agroindustriales. Facultad de Agrociencias. Universidad Técnica de Manabí, Ecuador,
cDepartamento de Posgrado. Facultad de Posgrado. Universidad Técnica de Manabí, Chone, Ecuador,
dCarrera de Ingeniería Industrial. Facultad de Ingeniería y Ciencias Aplicadas. Universidad Técnica de Manabí. Portoviejo, Ecuador,
eCarrera de Electricidad. Facultad de Ingeniería y Ciencias Aplicadas. Universidad Técnica de Manabí. Portoviejo, Ecuador,
fCarrera de Pedagogía de las ciencias experimentales de la Química y Biología. Facultad de Ciencias de la Educación. Universidad Técnica de Manabí. Portoviejo. Ecuador,
gDepartamento de Mecanica. Facultad de Ingeniería y Ciencias Aplicadas. Universidad Técnica de Manabí. Portoviejo, Ecuador,
hDepartamento de Química. Facultad de Ciencias Básicas. Universidad Técnica de Manabí. Portoviejo, Ecuador,
iGrupo de Investigación Nutrición Dietética, Biotecnología y Análisis de Alimentos (GINDBA). Universidad Estatal de Milagro
Keywords
Abstract
Background/Aims:
Due to rapid metabolic and growth rates during the first two years of life, the nutritional needs of young children are high. Given the small portion sizes consumed by children between the ages of 6 and 24 months, it is necessary to improve diets to meet the nutritional needs of this age group. Therefore, the analysis of lysine content is an important parameter in the evaluation of enriched foods.Methods:
The utilization of an enzymatic sensor employing lysine-α-oxidase (LOx) as a biorecognition element represents an alternative to the existing methods. This sensor was optimized for quantifying the lysine content in flour mixtures: Quinoa-Lablab purpureus rye - Lablab purpureus, and pole beans - Lablab purpureus, with a maximum ratio of 85g/100g.Results:
The addition of lablab purpureus significantly increased the lysine concentration in the enriched samples. When 30 percent was substituted in quinoa, it reached a 143 percent increase. And when 15 percent was substituted in the rye flour, the final concentration of this amino acid increased by 64 percent. In order to quantify the lysine concentration, it was necessary to optimize various parameters during the use of the sensor, e.g. a potentiometric signal was detected upon the depletion of oxygen present during the oxidation of lysine in the samples, and the sensor response was recorded at 2 s. This was possible due to the modification of the pH and the thickness of the membrane. The oxidation of lysine is catalyzed by LOx using molecular oxygen as the electron acceptor. The corresponding acidic compounds and hydrogen peroxide were formed in the reaction medium.Conclusion:
It was possible to increase and verify the concentration of lysine in all the flours tested through the use of the biosensor, which turned out to be a valid method for controlling the nutritional quality of flours.Introduction
The importance of cereals in ensuring global food security can be quantified by their contribution to calorie intake, which can reach up to 35% of the global population [1]. Cereal-based products are consumed worldwide. However, inadequate protein intake causes chronic malnutrition and diseases, affecting over one-third of the global population. In Africa alone, 49 million children suffer from growth stunting [2, 3,4].
Globally, overweight and obesity pose significant challenges for health regulatory bodies. Reports indicate that 42 million children were overweight or obese, with a significant increase of 47% between 1980 and 2013 [5]. This trend can be explained by the dietary habits of this population. For instance, skipping breakfast and consuming highly sugary beverages have been shown to affect waist circumference as well as low physical activity during leisure time at school [6]. Cardiorespiratory health is also associated with dietary habits [7].
As a result, most studies have focused on combating iron and protein deficiencies, as these parameters are predominant in the population. Alternatives have been proposed to address this challenge in public health [8]. For example, recent studies have attempted to improve the quality and concentration of lysine in cereals by utilizing various irrigation regimes as a strategy [9].
Another study demonstrated that the consumption of lysine-rich transgenic rice was safe and improved growth and skeletal development in newly weaned rats [10]. Methods have also been developed to increase the rate of lysine formation during fermentation by controlling the proportions of carbon, nitrogen, residual sugar, ammoniacal nitrogen, and dissolved oxygen in specific substrates, thereby optimizing the processes [11].
In the field of industrial development, researchers have studied the functional properties of proteins present in hydrolysates. One approach has been to incorporate lysine as a protein modifier to enhance technological properties such as antioxidant capacity, foaming capacity, and emulsifying properties [12]. Significant amounts of iron and proteins have been incorporated into baked bread using beans and lentils [13, 14]. The response to this issue focuses on the food fortification of mass-consumed products as a strategy to increase nutritional value and correct nutritional deficiencies [15]. In the case of flours, incorporating micronutrients, such as lysine, can help meet the recommended daily dose of 500-1500 mg for children when taken orally [16].
Lysine concentrations have been analyzed in various foods including wheat, cheese, and yogurt [17, 18, 19]. Techniques have been developed to increase its concentration by incorporating genes into different varieties of corn [20]. In this context, lysine analysis is a promising strategy to reduce malnutrition in the population. The proposed flour blends could serve as a complement to wheat flour to improve its nutritional composition, allowing for the production of products such as bread and cookies. This is due to their suitable emulsifying qualities for dough preparation. These are promising raw materials for the development of protein-rich food ingredients.
In addition, cereals contain proteins, fiber, and phenolic compounds that provide health benefits such as preventing type II diabetes and reducing cholesterol levels [21, 22].. The basis of the proposed technique is that LOx catalyzes the oxidation of the substrate (lysine), thereby reducing the present oxygen to form the acid α-Keto-ԑ-aminocaproic + H2O2+ NH3, equation 1 [23]. $${ \text{L-Lysine} + \text{O}_2 \longrightarrow \alpha\text{-Keto-}\varepsilon\text{-aminocaproic} + \text{H}_2\text{O}_2 + \text{NH}_3 \hspace{100px} \text{(Eq. 1)}}$$
Fig. 1 shows a system for quantifying lysine using an enzyme as the biorecognition element.
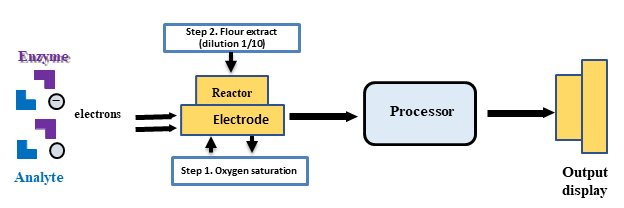
Fig. 1: Shematic representation of key principle of developing a biosensor.
Thus, the objective of this study was to develop a sensor that allows quantifying the concentration of lysine in different infant flours using as raw material quinoa, lablab purpureus, rye; and pole beans.
Materials and Methods
Chemical and reagents
The reagents used in this research were as follows: Sodium acetate anhydrous, were obtained from Merck (KGaA, Darmstadt, Germany). Lysine oxidase (LOx, E.C.1.4.3.14 from Trichoderma viride, each vial contains 4.6 mg of protein with 20 – 60 units/mg protein), L- lysine, glutaraldehyde (55%), o-phthaldialdehyde (OPA), 2-mercaptopropionic acid, and HCL were purchased from Sigma-Aldrich (St. Louis, MO, USA). Bidistilled Milli-Q water was used in all studies.
Preparation of the LOx Solution
Sample preparation consists of dissolving the lyophilized enzyme in 15mL of potassium phosphate buffer (pH 7.3) with an activity of 13.5 U/mL. It was stored in Eppendorf tubes at -40°C, to avoid loss of activity [23].
Equipment
The enzyme sensor contains a double chamber allowing keep the water in recirculation at the working temperature of the enzyme, in its lower part it contains a clamping ring to adjust the membrane, allowing the separation between the electrode and the contents of the reactor. The current output was recorded data logger ADC-16 (TIP Technology Limited, St, Net. Cambridge, United Kingdom). Contains two parts a working electrode with a 2-mm diameter platinum disk of as well as a reference electrode (Ag/AgCl), capable of detecting oxygen consumption during the reaction.
The chromatographic analysis was performed using a YL9100 system manufactured by Young Lin Instrument CO., LTD (KOREA). A prisma Labnet model C2500 centrifuge was used to separate the liquid phase from the solid phase.
Sample preparation
After removing the moisture in the enriched flours, they were sieved using a #30 mesh.
To perform acid hydrolysis, 1 g of flour was weighed, and 10 mL of hydrochloric acid at a concentration of 1.2 N was added. The mixture was stirred for 30 min, was kept in contact with hydrochloric acid for 1 h to facilitate protein hydrolysis. Subsequently, it was filtered using a filter paper with a pore size of 0.25µm.
The solid phase was separated from the aqueous phase via centrifugation at 13, 000 rpm for 10 min. Subsequently, 1 mL of supernatant was extracted and diluted. The dilution ratio was 1/20 for the quinoa-hyacinth bean samples, 1/10 for the rye-hyacinth bean mixture, and 1/40 for the pole bean-hyacinth bean mixture.
Biosensor preparation and operation
To calibrate the sensor prior to use, the electric current must be constant (-600mV), the variations that occur are proportional to the consumption of the substrate when it reacts with the enzyme, this electrochemical reaction is monitored using a computer.
To determine the sensitivity, the oxygen concentration was fixed before starting the reaction. The reactor was filled with distilled water to achieve 100% initial oxygen, which occurred in less than a minute.
Immobilized enzyme sensor
The process of immobilizing enzymes for this sensor has been described using glutaraldehyde concentrations lower than 5% [24]. This percentage was analyzed, as indicated in the Results and Discussion sections. The ideal mixture (25 µL) in the solution contained 8 µL of LOx solution (7.5 U), 13 µL of 50 mM sodium phosphate buffer pH 7.3, and 4 µL of 50% glutaraldehyde solution. This mixture was placed drop-by-drop on an immunodyne ABC membrane (1.5 cm2) and then dried under air for 1 h to initiate crosslinking.
When using this enzyme, substrate, and buffer composition, reduced interference of the immobilized membrane on the oxygen electrode was observed. Optimal measurement signals were obtained by substituting the membranes after each analysis.
Description of the Chromatographic method
For the chromatographic analysis it was necessary to derivatize the sample. One microliter of sample was automatically derivatized RP-HPLC in the autosampler with OPA-mercaptopropionic acid. Thus, 1µl of sample was mixed with 5 µl of OPA reagent (50 mg OPA in 1ml methanol, addition of 50 µl of 2-mercaptoprooionic acid and taken to 10 ml with 0.04 M borate buffer, pH 10.4). The column used was a Hypersil C18, (3.0x150) mm and 3-µm particle size, column (Agilent Technologies, Palo Alto, CA, USA) maintained at 45°C.
The separation was achieved by means of a gradient between two solvents: 20 mM sodium acetate buffer, pH 7.2 as solvent A, and 100 mM sodium acetate buffer, pH 7.2/acetonitrile/methanol (20:40:40) (v/v) as solvent B. Fluorescence detection at excitation and emission wavelengths of 230 and 455 nm respectively were used. The calibration range used was between 2 -45 mM.
Assay of validation
The linearity of the sensor, where it was possible to quantify the concentration of lysine, was assessed in triplicate using different intervals of the standard (6-35 mM) within the system with the immobilized enzyme by applying the Ordinary Least Squares (OLS) regression method. Repeatability was assessed through experiments involving 25 consecutive injections using a 10 mM standard as well as samples of enriched flours. All analyses were conducted on the same day, using the same equipment. The formula used to calculate repeatability was:
Repeatability = 2.8 * standard deviation
Mean concentrations and coefficients of variation (%) were calculated. The correlation between the samples (soluble fraction of flours after acid hydrolysis) was quantified using different concentrations, and the results were compared using both sensor and ultraviolet-visible spectroscopy. The stability of lysine-α-oxidase (LOx) was verified during storage at 4°C for 200 days at intervals of 5 days. The analysis was conducted in triplicate and the average values and standard deviations were calculated.
Effect of other amino acids on the sensor
1.000 microliters of the enzyme solution (7.5 U) were placed in contact with 100 microliters of the substrates studied (lysine, phenylalanine, arginine, tyrosine, histidine, leucine, and ornithine), with a 5mM concentration. The oxidation percentage was measured both in the sensor and in the HPLC.
Behavior of the enzyme on the substrate
The effect was studied of the lysine -α- oxidase on lysine. In the presence of LOx, 2.000 µL of the enzyme solution plus 2.000 µL of a lysine standard solution 50mM (5mM in the reactor) or flour extract were brought to 20 mL of potassium phosphate buffer, pH 7.3, 0.05 M and left to react at 35°C under gently stirring. Every 30 s, 1.000 µL aliquot was taken and immediately mixed with 100 µL of hydrochloric acid (37°C) to stop the reaction. Aliquots were centrifuged (10.000 rpm for 10 min at 4°C) and analyzed by HPLC.
Statistical methods
Statistical analysis was conducted using Statgraphics Plus software (v5.1) to determine the linear relationship between lysine concentration and oxygen consumption. The linearity between the sensor and HPLC was analyzed using the coefficient of determination (R2) and standard error (SE).
In addition, a two-sample t-test (two-tailed) was used to determine whether the biosensor and HPLC results were statistically equal. The null hypothesis states that the population means are equal (H0: µsensor = µ HPLC), whereas the alternative hypothesis suggests that they are not (H0: µsensor ≠ µ HPLC).
Results
The sensor used to quantify lysine utilizes a preactivated membrane, which enables a covalent bond between the membrane surface and the enzyme base, facilitating proper sensor function. The most relevant optimized parameters were as follows:
Biosensor optimization
During the oxidation of lysine, it was observed that at high concentrations of the substrate the consumption of oxygen increases, this demonstrated the selectivity of the enzyme for this substrate, this process improved by applying a negative potential because the interferences decreased (Fig. 2). The reaction of the enzyme by the substrate improved as the thickness of the membrane decreased, a good result was observed with 0.25µm
Repeatability was analyzed and expressed as coefficient of variation (CV). To achieve this, a standard solution of 10 mM or enriched flour extract sample was consecutively injected 25 times. With the purpose of obtaining consistent results, all factors were kept controlled to guarantee repeatable and reliable measurements, thus, the results obtained were calculated under the same conditions (same equipment, same day and at the same time). The CV values obtained for the flours and standards were 2.3% and 1.8%, respectively, indicating acceptable sensor performance. This allowed for good selectivity and precision in lysine quantification.
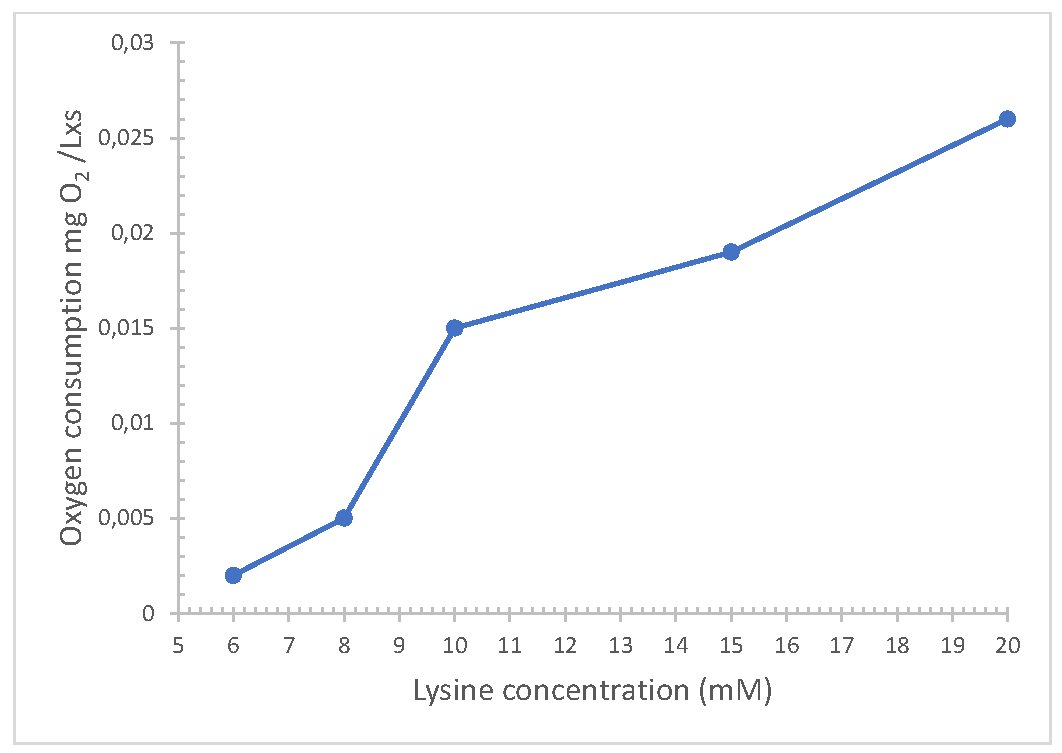
Fig. 2: Amperometric responses of the lysine sensor using the electrode Ag/AgCl/Lys.
Effect of pH and temperature
The pH and optimal temperature values depend on the origin and biological function, for that the enzyme can be used in the sensor different ranges were studied, as for the pH, it was analyzed using 50 mM sodium phosphate buffer within the range of 6.5 to 7.5. The enzyme exhibited the highest activity at pH 7.3 (Fig. 3). This indicates that the net charge of the enzyme is optimally configured for the interaction with the substrate. When studying the temperature, it was determined that at 35 C the activity of the enzyme presented greater activity, this is possibly due to the fact that the molecules of the enzyme and the substrate have enough kinetic energy to collide and react effectively.
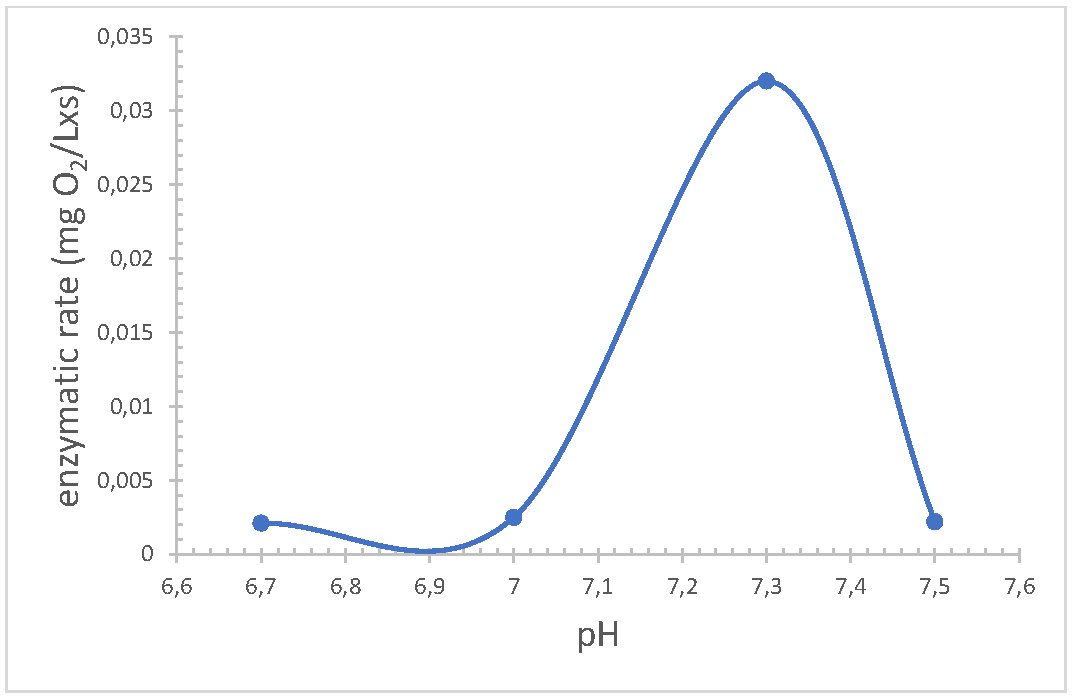
Fig. 3: Effect of pH on the rate of reaction of the enzyme Lysine -α-oxidase immobilised determined by the enzyme sensor. n=3.
Optimum amount of enzyme
The amount of enzyme tested on the sensor with the immobilized enzyme sensor was 6, 8 and 12 µL containing 6.2; 7.5, and 13.5 U (enzyme units) respectively. The best response was observed when 8 µL (7.5 U) was used. It is possible that at higher concentrations the active center of the enzyme is saturated. This value is equivalent to a protein concentration of 0.64 mg/mL.
Biosensor features
Quantification of lysine in the analyzed samples depended largely on the affinity of the enzyme for the substrate. This value was found to be KM = 0.025 mM, indicating good enzyme-substrate affinity, which has a direct relationship with enzymatic activity. After immobilization, a 26% loss of activity was observed upon placement on the membrane, which could be attributed to the final position acquired on the coupling surface.
These results are consistent with those reported by other authors [25, 26]. Therefore, it was necessary to replace the membrane for each measurement.
The Michaelis-Menten constant is calculated using equation 2.
$${ \color{red}{\left( \frac{s}{v} \right) = \frac{KM}{v_{\text{max}+1}} + V_{\text{max}}(S)} \hspace{100px} \text{(Ep. 2)}}$$
The reaction rate (Vmax) is the maximum point reached by the enzyme when it meets different concentrations of the substrate, in ascending order. This reaction rate stabilizes owing to saturation, which occurs when the active site of the enzyme becomes fully occupied. The letter s represents the concentration of the substrate.
Calibration curves
To develop a lysine sensor, it was necessary to construct a calibration curve with a linear trend. This involved increasing the substrate concentration under the previously optimized conditions. The concentration range used was 3-45 mM (R2=0.9924) (Fig. 4). The detection limit can be reduced by incorporating fluorescent probes into the sensor [27, 28]. Tables 1 and 2 display the lysine content in various samples of enriched flour, as well as their concentrations before and after fortification (by mixing flours in different proportions). These were quantified using a High-Performance Liquid Chromatography and the values were obtained experimentally using the LOx sensor.
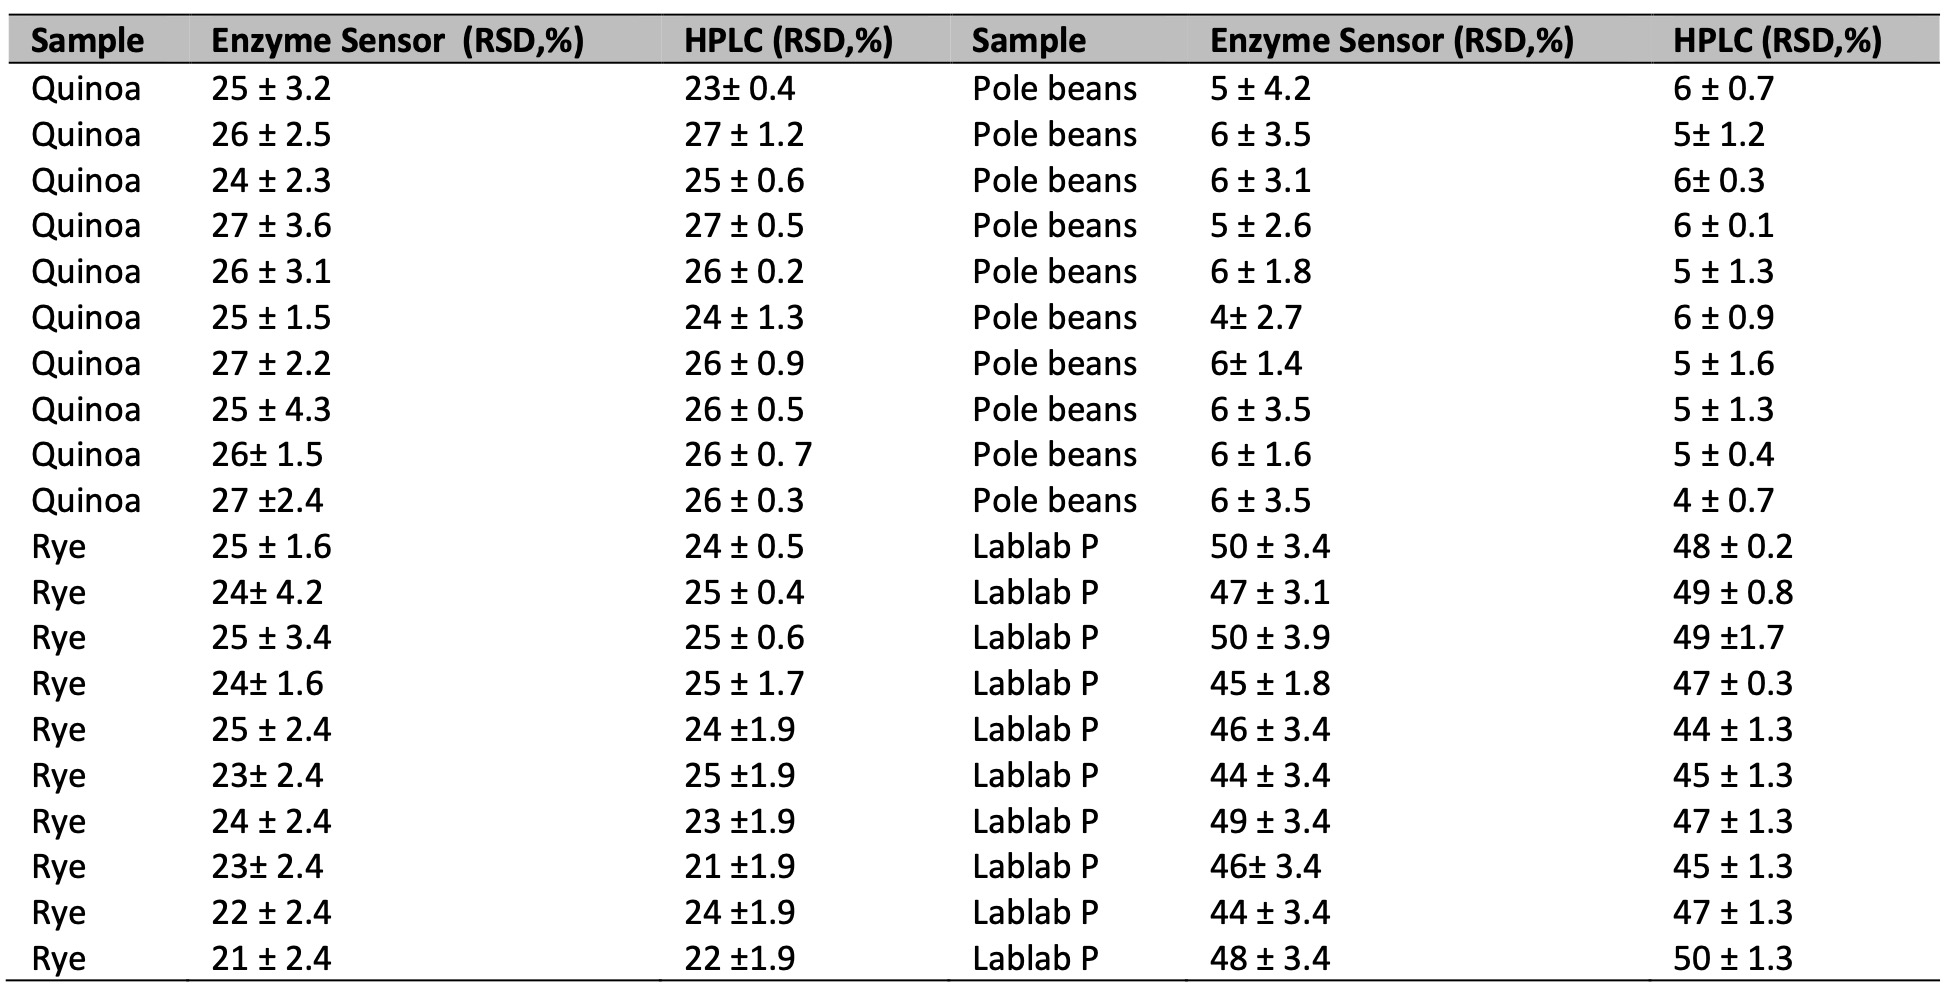
Table 1: Measurements lysine levels by the enzime sensor and High Performance
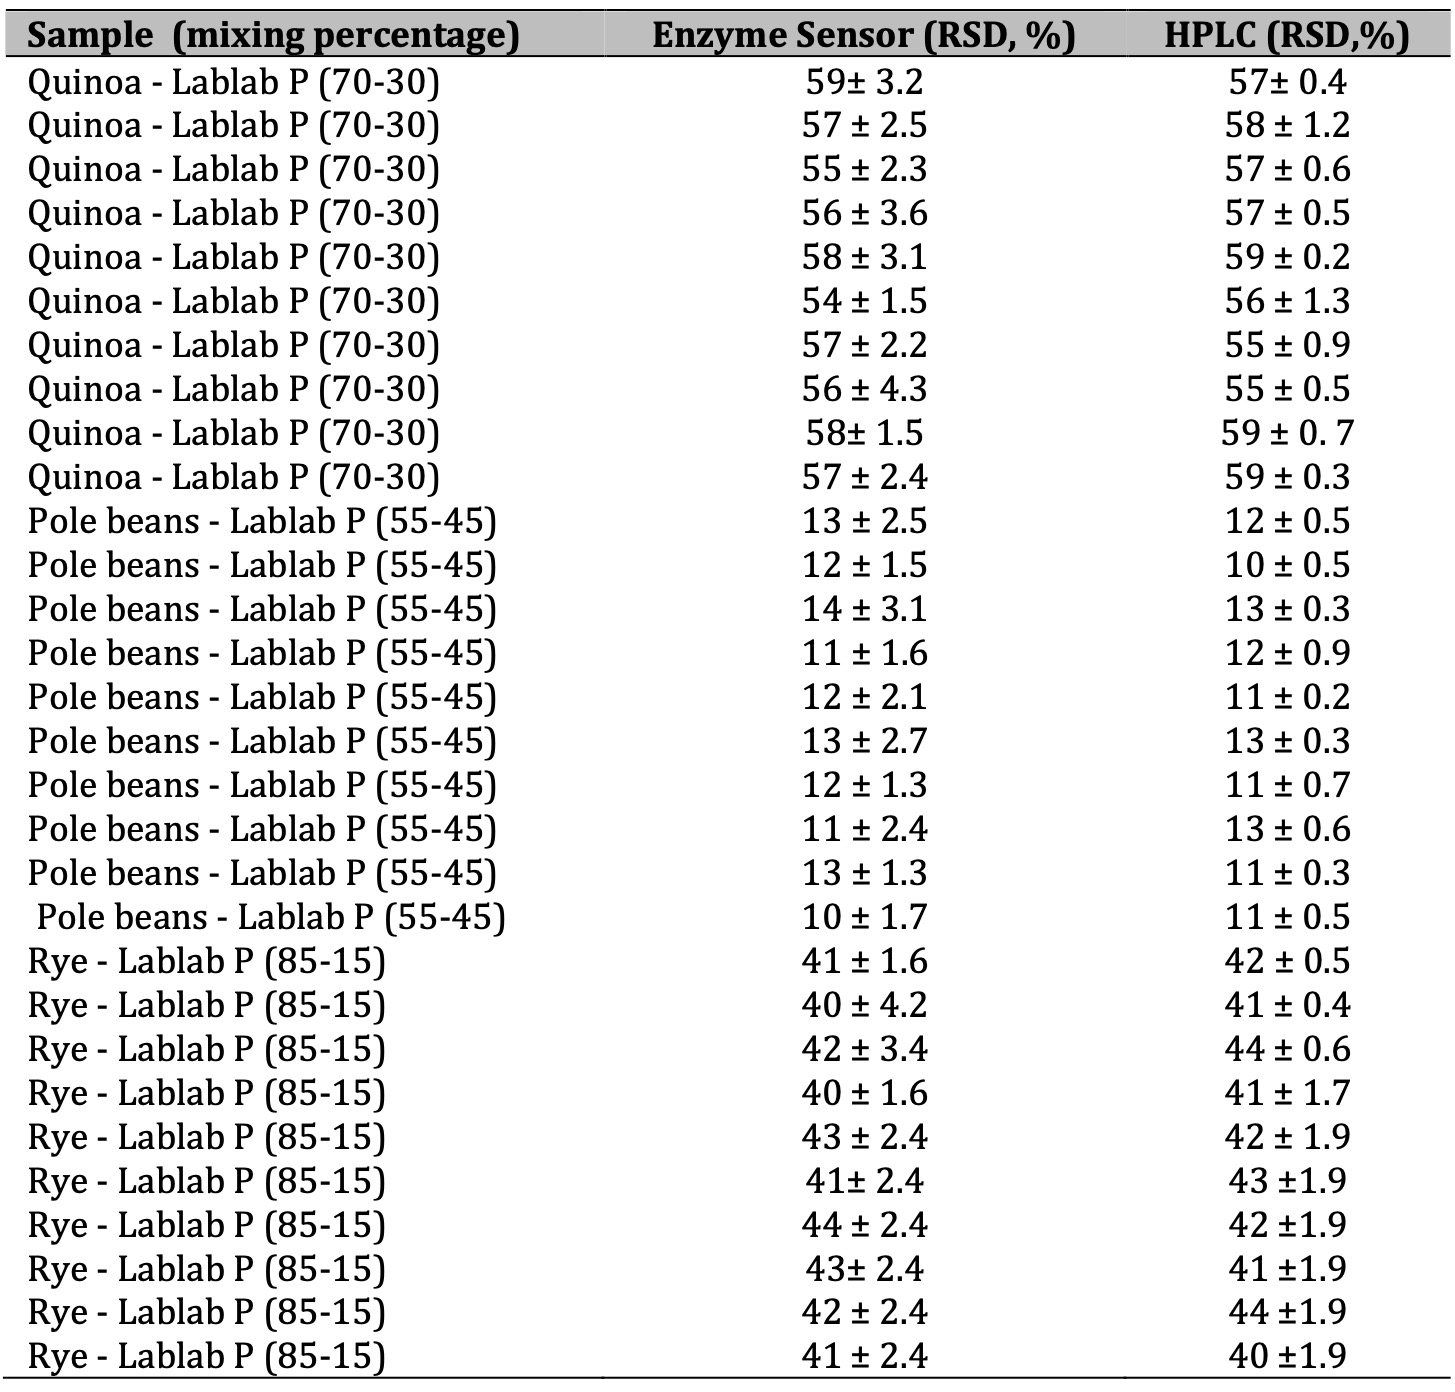
Table 2: Measurements lysine levels in flour mixtures by the enzime sensor and High Performance Liquid Chromatography. Results are expressed in mM ± CV (n=3)
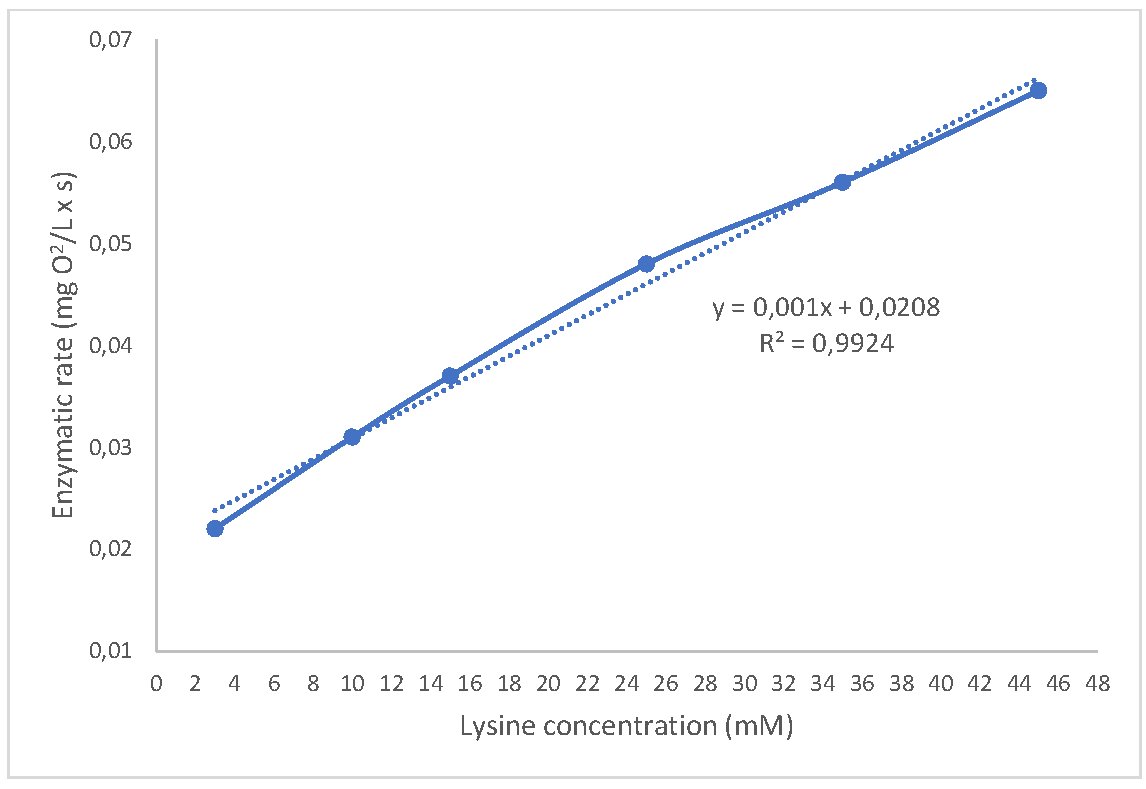
Fig. 4: Calibration curve obtained with the LOx biosensor at 35ᵒC in phosphate buffer 50 mM pH 7.3.
Lysine measurements using the biosensor compared with HPLC measurements
The enzymatic sensor was developed to evaluate the concentration of lysine in fortified cookie samples. For this purpose, it was necessary to assess the precision of the biosensor using six diluted samples, and these values were compared with those obtained by HPLC. The responses of the lysine sensor currents were linear up to 45 mM (upper limit of detection) and showed good correlation with a coefficient of determination R2=0.986, and a standard error of 0.015 (Fig. 5). These data make it possible to evaluate the accuracy of the sensor without loss of stability or sensitivity.
The concentration of lysine was statistically evaluated, determined by both the sensor approach and HPLC at a significance level of α=0.05. The difference in lysine concentrations measured by the biosensor (Ẋ= 1.2 and s=0.1174) and HPLC (Ẋ=1.35 and s= 0.1024) was not significantly different: t-value = 0.0634 (df=30) and p-value = 0.9231. These measurements validate the reliability of the biosensor as it could detect lysine within the measurement range.
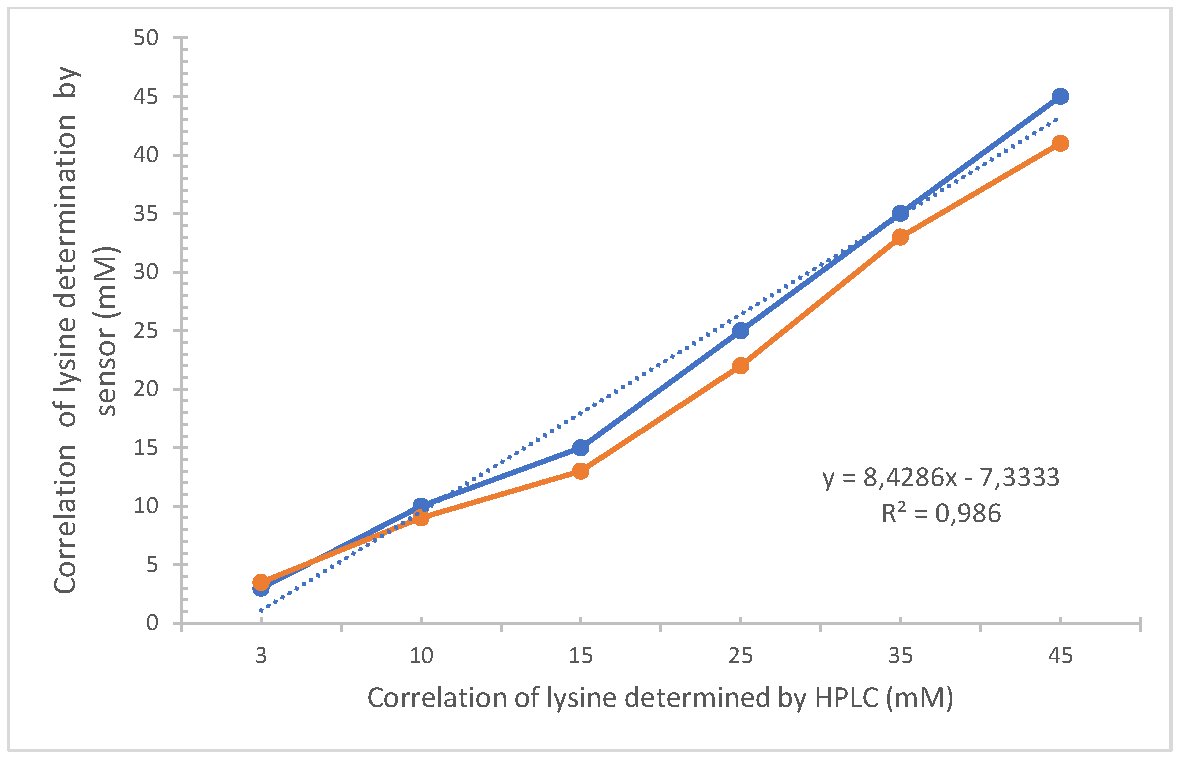
Fig. 5: Correlation between the content of lysine obtained with the enzyme sensor with the immobilized enzyme and High Performance Liquid Chromatography (n=3).
Effect of other amino acids on the sensor
To determine if the different amino acids compete for the active center of the enzyme, decreasing the amount of analyte that can be quantified the percentage of oxidation was studied, using the enzyme soluble at 35°C. Phenylalanine had the highest interference potential, considering that other amino acids responded to the stimulus (Table 3). When the sensor was used, ornithine and phenylalanine presented a degree of oxidation; in this case, only these amino acids showed any response. The interference of other amino acids was ruled out because small variations were observed, and the affinity of the enzyme to the substrate was confirmed because the degradation was almost selective in the presence of lysine.
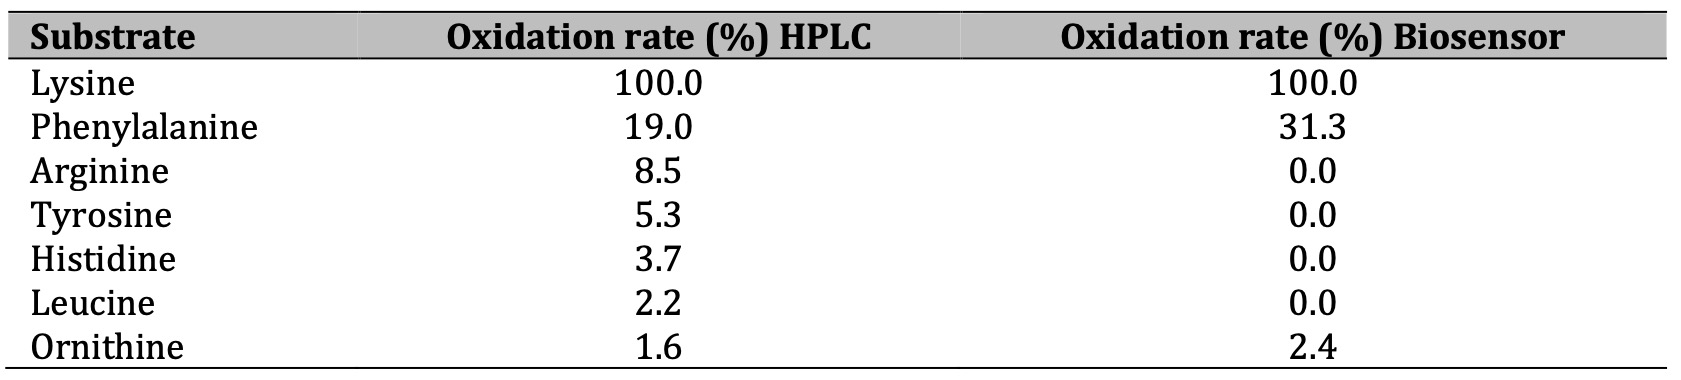
Table 3: Oxidation rate of the enzyme onto some free amino acids
Modification of pH in the membrane
The change in pH on the surface of the membrane was evaluated to improve the response of the sensor immersing the membrane in phosphate buffer for 24 hours, the range was between 6 -7.9, it was observed that the sensitivity of the sensor increased up to one decimal unit when successively injected into the membrane with a pH of 7.3 (Fig 6). This may be due to the fact that the active center of the enzyme is better coupled, under the conditions indicated above.
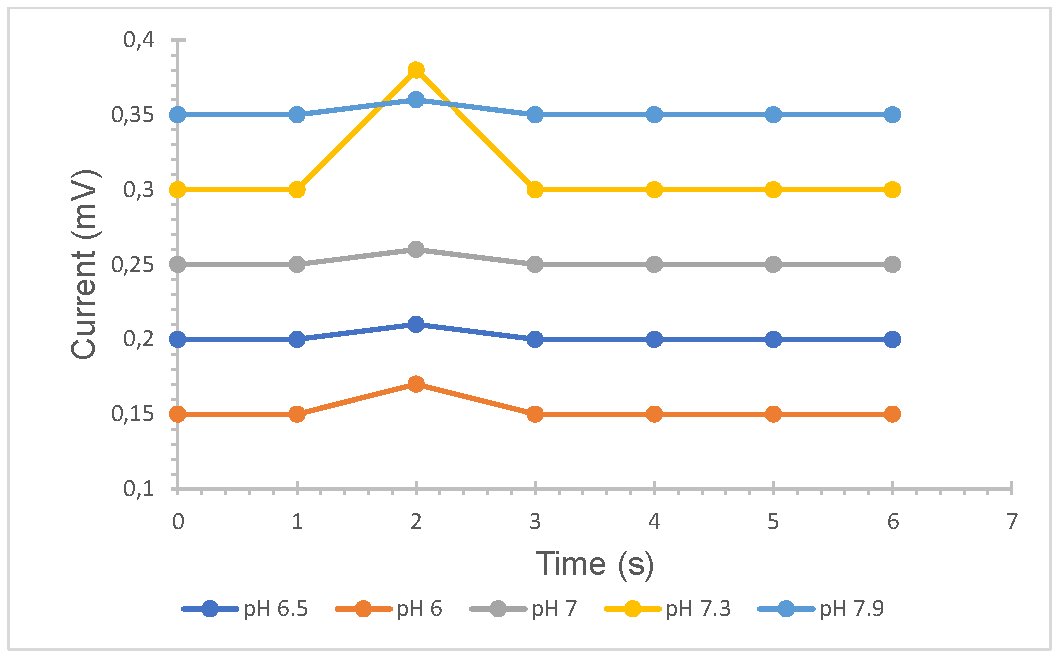
Fig. 6: Comparison of LOx sensor sensitivity using a preactivated immunodyne ABC membrane with different pHs.
Behavior of the enzyme on the substrate
Substrate depletion during the enzymatic reaction was analyzed by high performance liquid chromatography. The total disappearance of the substrate was observed when the reaction was carried out at the temperature and pH previously studied (Fig. 7a). This allowed it to be tested in an extract of fortified flour. This was diluted to an approximate content of 50mM (5mM in the reactor). The rate of consumption and disappearance was very similar. This confirmed the low interference of the other amino acids present in the enriched flours and the high catalytic power of the lysine alpha-oxidase enzyme. (Fig 7b).
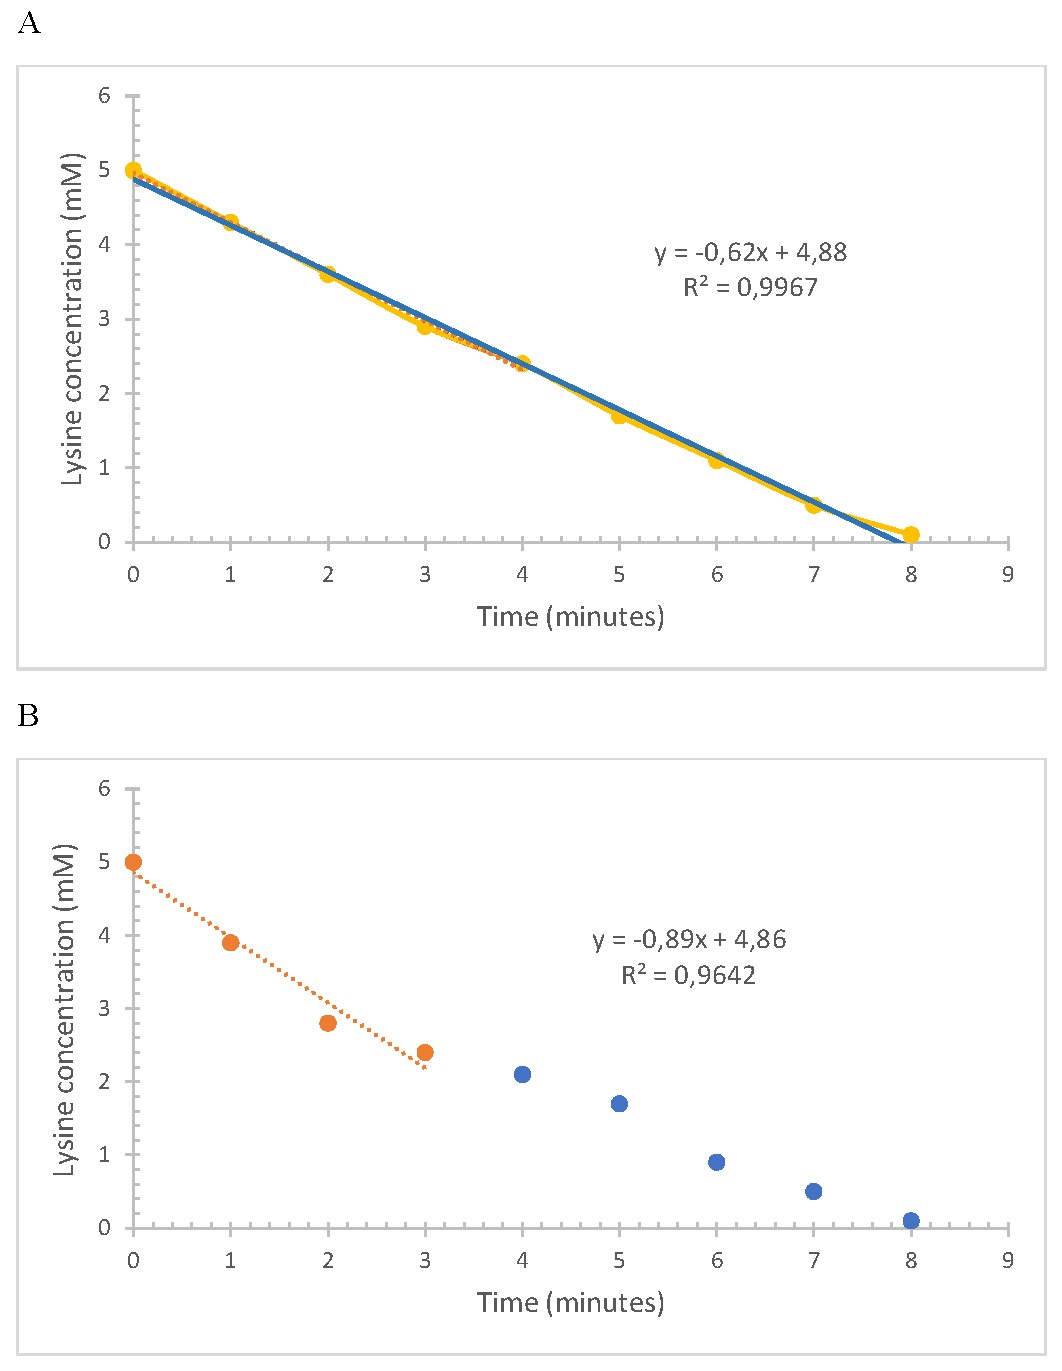
Fig. 7: Action of LOx soluble enzyme incubated at 35°C and pH 7.3 using as substrate: a standard 5 mM (a) and a flour extract (b).
Discussion
Based on the results obtained, it has been demonstrated that the enrichment of flours with Lablab purpureus allowed to obtain high levels of lysine in the tested mixture. These concentrations were analyzed by the sensor with a good correlation between with the reference method (R2=0.986) was obtained, measuring lysine as a quality marker in linear ranges higher than those reported in the literature. The method showed good sensitivity (3 mM) and reduced detection time. Interferences from the other amino acids present were negligible, so the noise floor was not a problem.
This method can be considered a valid technique for quantifying lysine in plant-based flour. The development and application of this analytical technique can be implemented at the industrial level for other foods rich in essential amino acids.
Acknowledgements
F.A Jadán Piedra acknowledged scholarship from Secretaria de Educación Superior, Ciencia, Tecnología e Innovación (SENESCYT) Ecuador.
The present study was approved by the Ethics Committee of the Technical University of Manabí; it does not involve studies on humans or on human or animal tissues.
This work has not received any funding.
Disclosure Statement
The authors have no conflicts of interest to declare.
References
| 1 | Polat PO, Cifci EA, Yagdi K. Stability Performance of Bread Wheat (Triticum aestivum L) lines. L Agr Sci Techol 2016;18:553-560.
|
| 2 | FAO. The state of food insecurity in the World 2013. 2013. Available from: https://www.fao.org/3/i3434e/i3434e.pdf
|
| 3 | Gillespie S, van den Bold M. Agriculture, food systems, and nutrition: Meeting the challenge. Global Chall 2017;1:DOI: 10.1002/gch2.201600002.
https://doi.org/10.1002/gch2.201600002 |
| 4 | WHO. Levels and trends in child malnutrition: Key findings of the 2019 edition. 2019. Available from: https://iris.who.int/bitstream/handle/10665/331097/WHO-NMH-NHD-19.20-eng.pdf
|
| 5 | International Food Policy Research Institute (IFPRI). Global nutrition report 2015: Actions and accountability to advance nutrition and sustainable development. Washington, DC: International Food Policy Research Institute;2015.
https://doi.org/10.2499/9780896298835 |
| 6 | Aarnio M, Winter T, Kujala U, Kaprio J. Associations of health related behaviour, social relationships, and health status with persistent physical activity and inactivity: a study of Finnish adolescent twins. Br J Sports Med 2002;36:360-364.
https://doi.org/10.1136/bjsm.36.5.360 |
| 7 | Kafatos A, Codrington CA, Linardakis M. Obesity in childhood: The Greek experience. World Review of Nutrition and Dietetics. Basel: KARGER;2005;pp 27-35.
https://doi.org/10.1159/000088203 |
| 8 | WHO, Nutrition International, UNICEF. Micronutrient survey manual. Geneva, WHO; 2020. Available from: https://www.who.int/publications/i/item/9789240012691
|
| 9 | Jiang Y, Tao W, Zhang W, Wang Z, Yang J. Wetting alternating with partial drying during grain filling increases lysine biosynthesis in inferior rice grain. Crop J 2024;12:262-270.
https://doi.org/10.1016/j.cj.2023.11.008 |
| 10 | Suen PK, Zheng L, Yang Q, Mak W, Yu PW, Ying Mo K, et al. Lysine-rich rice partially enhanced the growth and development of skeletal system with better skeletal microarchitecture in young rats. Nutr Res 2024;121:67-81.
https://doi.org/10.1016/j.nutres.2023.11.005 |
| 11 | Li H, Chen J, Li X, Gan J, Liu H, Jian Z, et al. Artificial neural network and genetic algorithm coupled fermentation kinetics to regulate L-lysine fermentation. Bioresour Technol 2024;393:130151.
https://doi.org/10.1016/j.biortech.2023.130151 |
| 12 | Zhu B, Yang J, Yu J, Dou J, Ning Y, Qi B, et al. Effects of l-arginine/l-lysine modifications on the protein structure, binding interactions, and functional properties of soy protein hydrolysate. Food Hydrocoll 2024;146:109319.
https://doi.org/10.1016/j.foodhyd.2023.109319 |
| 13 | Bouhlal O, Taghouti M, Benbrahim N, Benali A, Visioni A, Benba J. Wheat-lentil fortified flours: health benefits, physicochemical, nutritional and technological properties. J Mater Environ Sci 2019;10:1098-1106.
|
| 14 | Benayad A, Taghouti M, Benali A, Aboussaleh Y, Benbrahim N. Nutritional and technological assessment of durum wheat-faba bean enriched flours, and sensory quality of developed composite bread. Saudi J Biol Sci 2021;28:635-642.
https://doi.org/10.1016/j.sjbs.2020.10.053 |
| 15 | Boen TR, Soeiro BT, Pereira Filho ER, Lima-Pallone JA. Evaluation of iron and zinc content and centesimal composition of enriched wheat and maize flour. Braz J Pharm Sci 2007;43:589-596.
https://doi.org/10.1590/S1516-93322007000400012 |
| 16 | AEP. Asociación Española de Pediatría. Pediamècum. Hidrocloruro de L-lisina. 2020. Available from: https://www.aeped.es/comite-medicamentos/pediamecum/hidrocloruro-l-lisina#:~:text=DOSIS%20Y%20PAUTAS%20ADMINISTRACI%C3%93N,al%20d%C3%ADa%20por%20v%C3%ADa%20oral.pdf
|
| 17 | Le Bourgot C, Liu X, Buffière C, Hafanaoui N, Salis L, Pouyet C, et al. Development of a protein food based on texturized wheat proteins, with high protein digestibility and improved lysine content. Food Res Int 2023;170:112978.
https://doi.org/10.1016/j.foodres.2023.112978 |
| 18 | Jadán Piedra F, Rojas C, Latorre Castro GB, Maldonado Alvarado P. Selective determination of lysine in mozzarella cheese using a novel potentiometric biosensor. Food Biotechnol. 2023;37:41-53.
https://doi.org/10.1080/08905436.2022.2163251 |
| 19 | Ciriello R, Cataldi TRI, Crispo F, Guerrieri A. Quantification of l-lysine in cheese by a novel amperometric biosensor. Food Chem 2015;169:13-19.
https://doi.org/10.1016/j.foodchem.2014.07.141 |
| 20 | Talukder ZA, Chhabra R, Muthusamy V, Gain N, Katral A, Mishra SJ, et al. Recessive waxy1 and opaque2 genes synergistically regulate accumulation of amylopectin, lysine and tryptophan in maize. J Food Compost Anal 2023;121:105392.
https://doi.org/10.1016/j.jfca.2023.105392 |
| 21 | Emmons CL, Peterson DM, Paul GL. Antioxidant capacity of oat (Avena sativa L.) extracts. 2 In vitro antioxidant activity and contents of phenolic and tocol antioxidants. J Agric Food Chem 1999;47:4894-4898.
https://doi.org/10.1021/jf990530i |
| 22 | Raguindin PF, Adam Itodo O, Stoyanov J, Dejanovic GM, Gamba M, Asllanaj E, et al. A systematic review of phytochemicals in oat and buckwheat. Food Chem 2021;338:127982.
https://doi.org/10.1016/j.foodchem.2020.127982 |
| 23 | Jadán F, Aristoy M-C, Toldrá F. Selective determination of lysine in dry-cured meats using a sensor based on lysine-α-oxidase immobilised on a nylon membrane. Food Anal Methods 2016;9:2484-2490.
https://doi.org/10.1007/s12161-016-0425-6 |
| 24 | Hernández-Cázares AS, Aristoy M-C, Toldrá F. Hypoxanthine-based enzymatic sensor for determination of pork meat freshness. Food Chem 2010;123:949-954.
https://doi.org/10.1016/j.foodchem.2010.04.066 |
| 25 | Venkatesagowda B, Dekker RFH. A rapid method to detect and estimate the activity of the enzyme, alcohol oxidase by the use of two chemical complexes - acetylacetone (3, 5-diacetyl-1, 4-dihydrolutidine) and acetylacetanilide (3, 5-di-N-phenylacetyl-1, 4-dihydrolutidine). J Microbiol Methods 2019;158:71-79.
https://doi.org/10.1016/j.mimet.2019.01.021 |
| 26 | Linke D, Lehnert N, Nimtz M, Berger RG. An alcohol oxidase of Phanerochaete chrysosporium with a distinct glycerol oxidase activity. Enzyme Microb Technol 2014;61-62:7-12.
https://doi.org/10.1016/j.enzmictec.2014.04.001 |
| 27 | Lavanya R, Poovarasan S, Srinivasadesikan V, Lin M-C, Padmini V. Selective fluorescence turn-off detection of lysine by a curcumin derivative with real sample analysis. J Photochem Photobiol A Chem 2023;444:115008.
https://doi.org/10.1016/j.jphotochem.2023.115008 |
| 28 | Wei S, Wang C, Wang Y, Yin X, Hu K, Liu M, et al. Chiral carbon dots derived from tryptophan and threonine for enantioselective sensing of L/D-Lysine. J Colloid Interface Sci 2024;662:48-57.
https://doi.org/10.1016/j.jcis.2024.02.063 |